Attending An Event
Account Settings
Billing and Payment
Account Settings
Delete Your Account
Link Facebook or Google
ID or Passport Number Not Valid
Edit Details on Your Profile
Privacy and Security
Tickets
Cashless
Howler Active
Organising An Event
Getting Started
Video Tutorial - Getting Started
Organiser Approval Process
Getting Started with Howler
Our Services
Getting Paid
Howler Customer Support
Payment Gateway Options - For organisers
Manage your account
Setup your event
How to create an event
How to Make My Event Searchable on Howler.co.za
Event Look and Feel
Ticket Type Settings
How to enable donations for your event
Express Checkin
Enable Ticket Resale for your Event
Marketing Tools
Ticket Reps
How to drive ticket sales
Ticket Bundles and Specials
Issue Complimentary Tickets
Custom Ticket Type Links
Marketing Tools - Sending an email campaign
Marketing Tools - Sending an SMS campaign
Setting Up Google Analytics Tracking
Integrating the Facebook Pixel
Howler Brand/CI/Style Guide
Embedded links
Create a QR code linking to your ticketing page
Sponsor Assigning Complimentary Tickets
Event Customisation
Event Page Customisation within the organiser portal
Premium Event Customisation
How to Optimize an Image
Going Cashless
Going Cashless with Howler
Howler RFID Wristband Design Template
Vendor fees - For organisers
Cashless Sales Reports
How to drive Online Topups for a Cashless event.
Cashless Customer Journey
Ticket Scanning
Reporting
Event Protect
Howler Backend - Active Admin
Howler Backend Active Admin
Howler Backend Active Admin - Manage Organiser Roles
Howler Backend Active Admin - Reps
Howler Backend Active Admin - GTM configuration
Howler Backend Active Admin - Create Ticket Types
Howler Backend Active Admin - Promo Codes
Howler Backend Active Admin - Create a Pre Registration Event
Howler Backend Active Admin - Unique Registration
Howler Backend Active Admin - Data Capture
Streaming Online Events
How to create an Online Streaming Event
How to enable Express Check-in for your event
Finding your stream URL
How to schedule a Facebook Live video stream - Using your computer
How to start a Facebook Live video stream - Using your mobile device
How to setup a private Zoom web conference
Pulse
Dashboard Guide 1.1. Ticketing Overview YoY Analysis
Dashboard Guide 1.2. Daily Sales Dashboard
Dashboard Guide 1.3. Ticket Type YoY Analysis
Dashboard Guide 1.4. Price YoY Analysis
Dashboard Guide 1.5. Payment YoY Analysis
Dashboard Guide 4. Audience YoY Analysis
Dashboard Guide 5. Abandoned Cart
Dashboard Guide 6.1.1. Event Sales Overview
Dashboard Guide 6.1.3. Bar Sales
Dashboard Guide 6.1.5. Event Sales Demographics
Dashboard Guide 6.3.1. Total Topups Overview YoY Analysis
Dashboard Guide 6.3.4. Total Topup Ticket Type YoY Analysis
Dashboard Guide 6.3.5. Total Topup Demographic
Dashboard Guide 6.1.4. Vendor Sales
Dashboard Guide 6.2. Cashless Check-Ins Dashboard
Dashboard Guide 6.1.6 Event Sales Ticket Type Analysis
Dashboard Guide 6.3.3. Onsite Topups YoY Analysis
Dashboard Guide 6.3.2. Online Topups YoY Analysis
Vendor at an event
Setting Up Your Vendor Account
Setting Up For An Event
Setting Up Your Menu
Editing Vendor Bank Details
How to use the Howler Cashless Point of Sales Devices - Training Video
Vendor Fees
Vendor Settlement
The Vendor Agreement
Vendor Sales Reports
Legal
Partners Resources
- All Categories
- Organising An Event
- Pulse
- Dashboard Guide 6.1.5. Event Sales Demographics
Dashboard Guide 6.1.5. Event Sales Demographics
 Updated
by Robyn Marais
Updated
by Robyn Marais
This dashboard provides a focused analysis of demographic and behavioural insights from event sales data, with a primary emphasis on customer age and gender. It complements other sales overview dashboards by breaking down total sales, product performance, and bar/vendor activity based on audience segments. This view enables event organizers to tailor future offerings, pricing, and marketing based on detailed attendee spending behaviour.
This guide walks you through each key element of the dashboard to explain what the visuals represent and how to interpret the data effectively.
The dashboard enables you to:
- Analyze spending behavior across different age groups and genders.
- Identify the top-selling products and average customer age for each.
- Understand peak spending times of day across the event timeline.
- Pinpoint top-performing bars and vendors and their transaction behavior.
- Assess ticket category and ticket type contributions to event revenue.
- Plan targeted marketing, product stocking, and staffing strategies based on audience profiles.
Key Metrics
Total Event Sales: Total revenue generated from all sales across the entire event, including bars and vendors.
Total Transactions: Total number of individual purchase transactions processed during the event.
Total Bar Sales: Total revenue generated specifically from all bar-related purchases at the event.
Total Vendor Sales: Total revenue generated by vendors selling food, merchandise, or services at the event.
Average Spend per Attendee: Average amount of money spent by each event attendee across all types of sales.
Average Orders per Person: Average number of purchase transactions made per attendee.
Average Spend per Attendee: Bar: Average amount spent per attendee specifically at the bars.
Average Spend per Attendee: Vendor: Average amount spent per attendee specifically at vendor stalls.
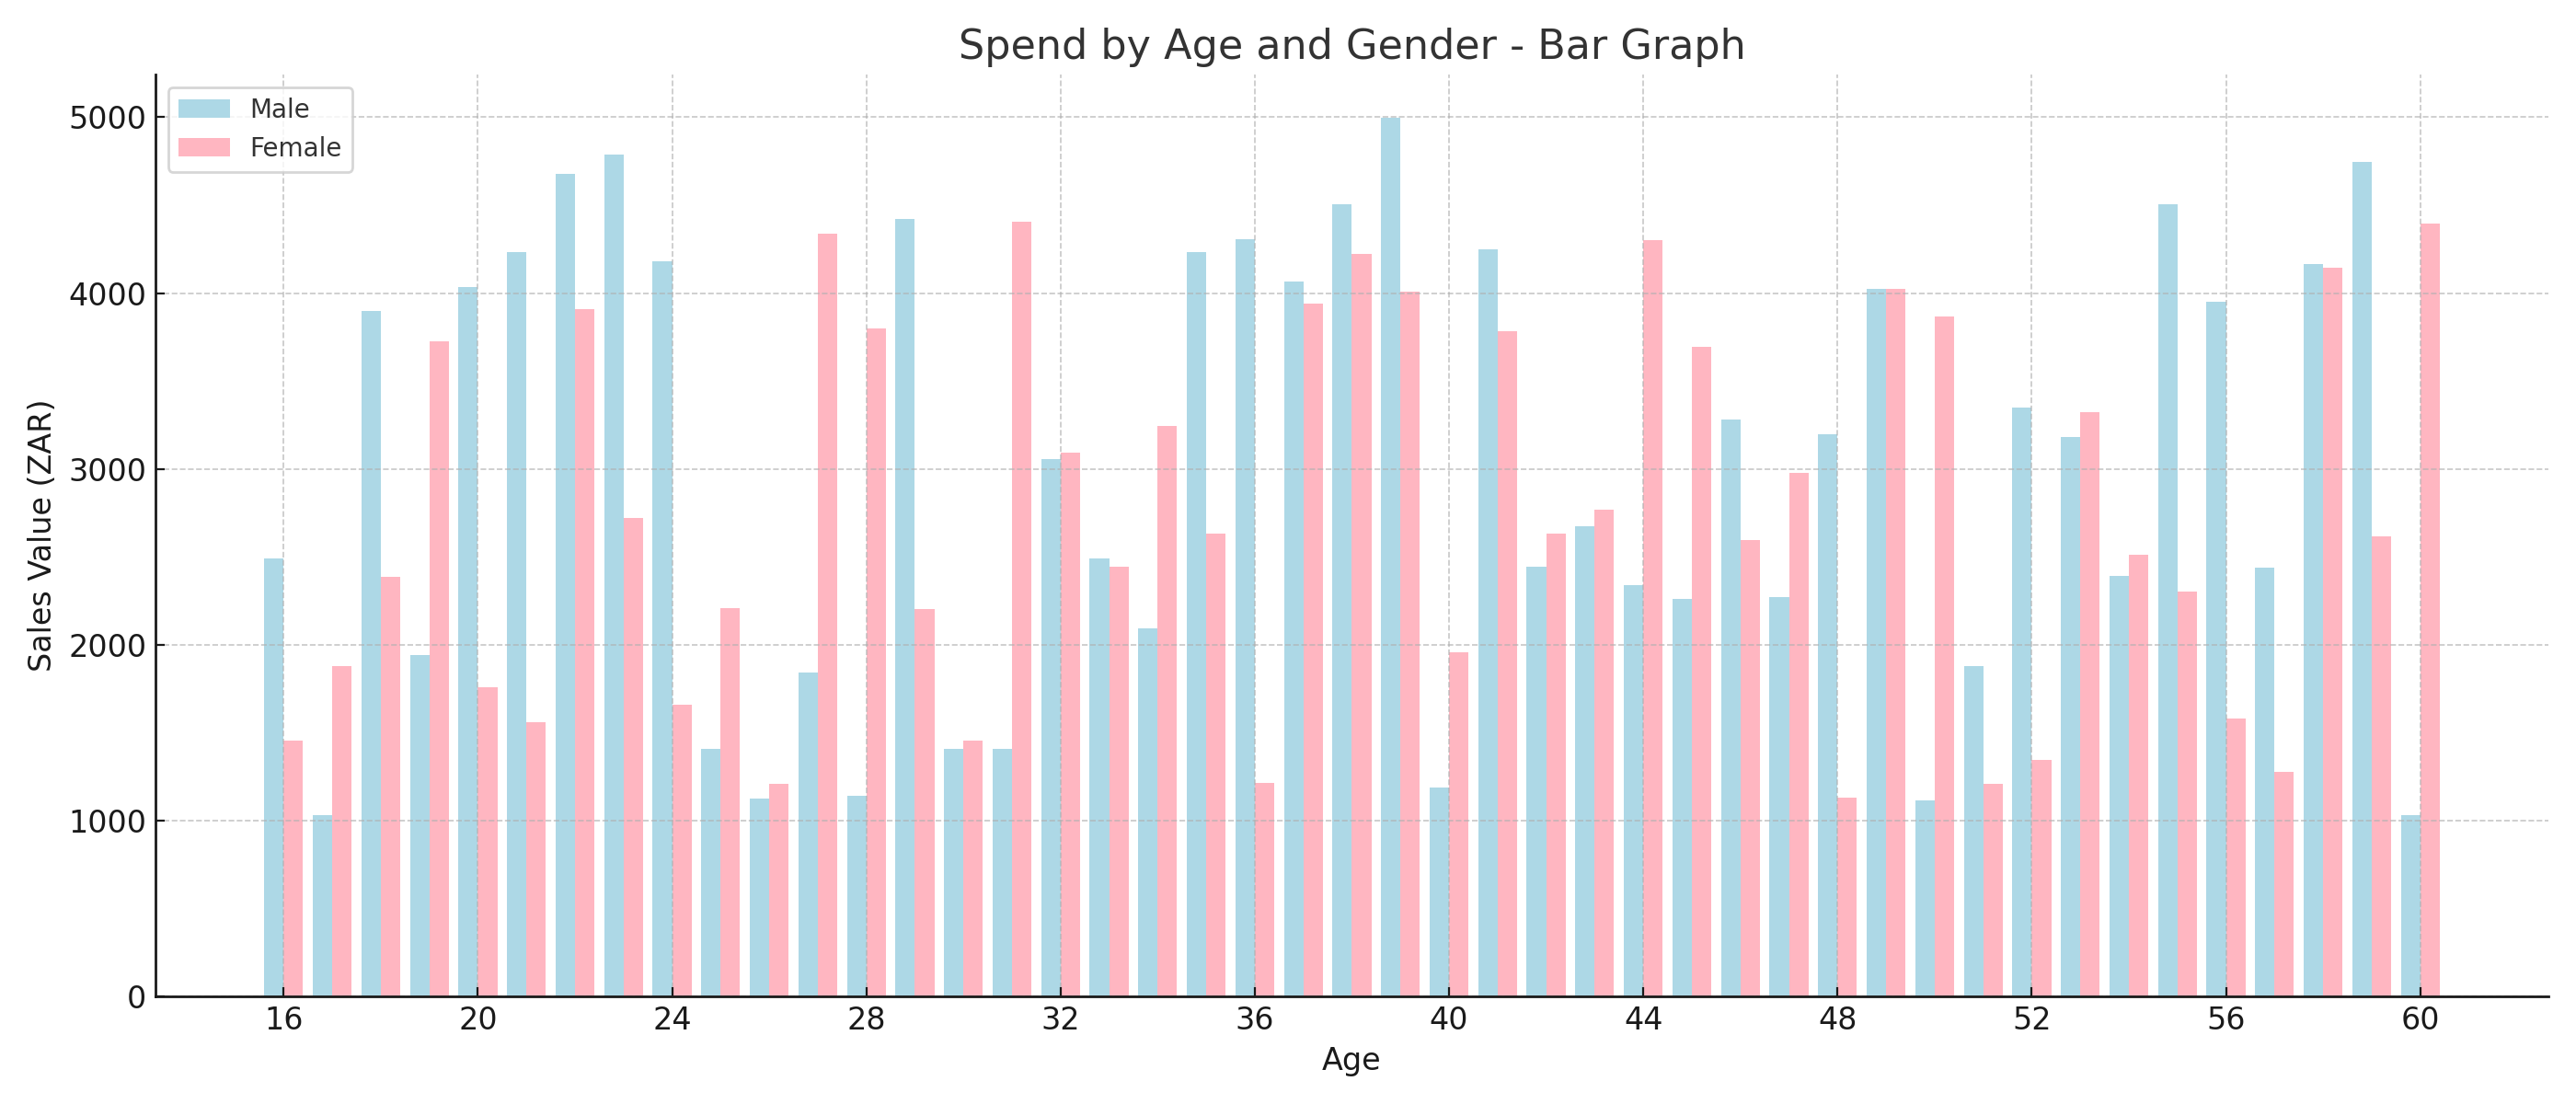
Spend by Age & Gender
A multi-line graph plotting total sales value by age group and gender.
How to use it:
- Identify which age and gender segments are contributing most to revenue.
- Tailor marketing campaigns and on-site activations toward high-value demographics.
- Plan inventory or experience offerings based on dominant segments.
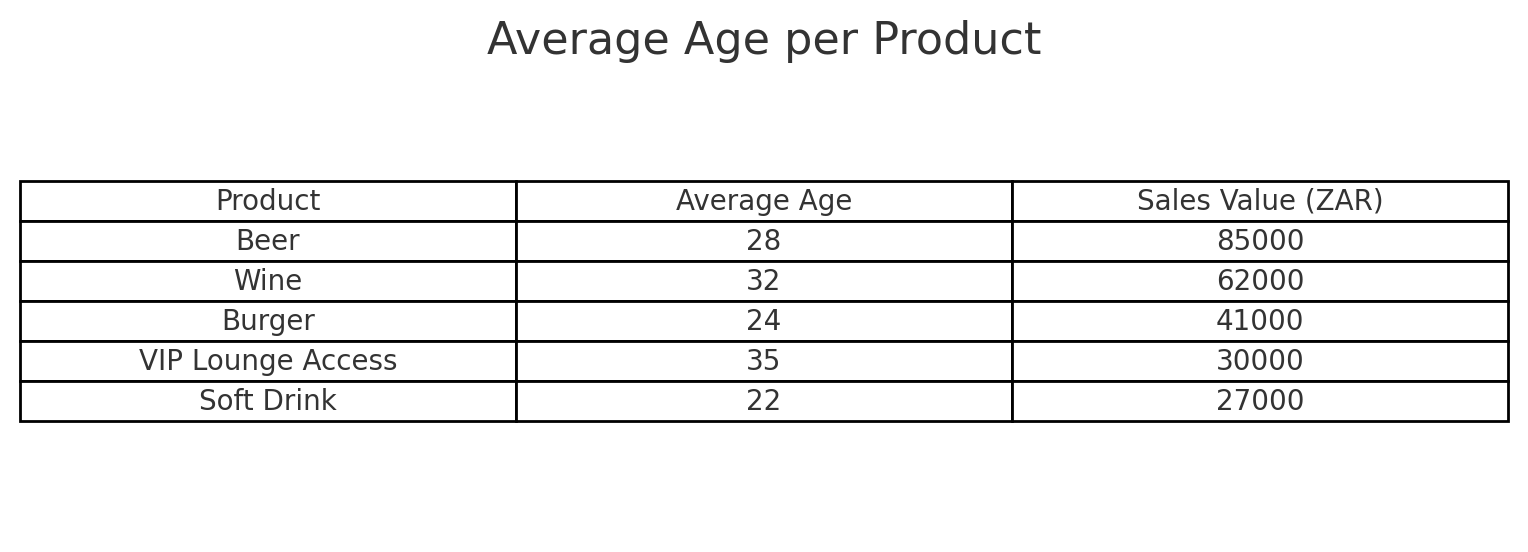
Average Age per Product
A table listing the average age of customers per product alongside total sale amounts.
How to use it:
- Understand which products appeal more to younger vs older attendees.
- Inform stock purchasing and promotion planning.
- Optimize product placement based on target age demographics.
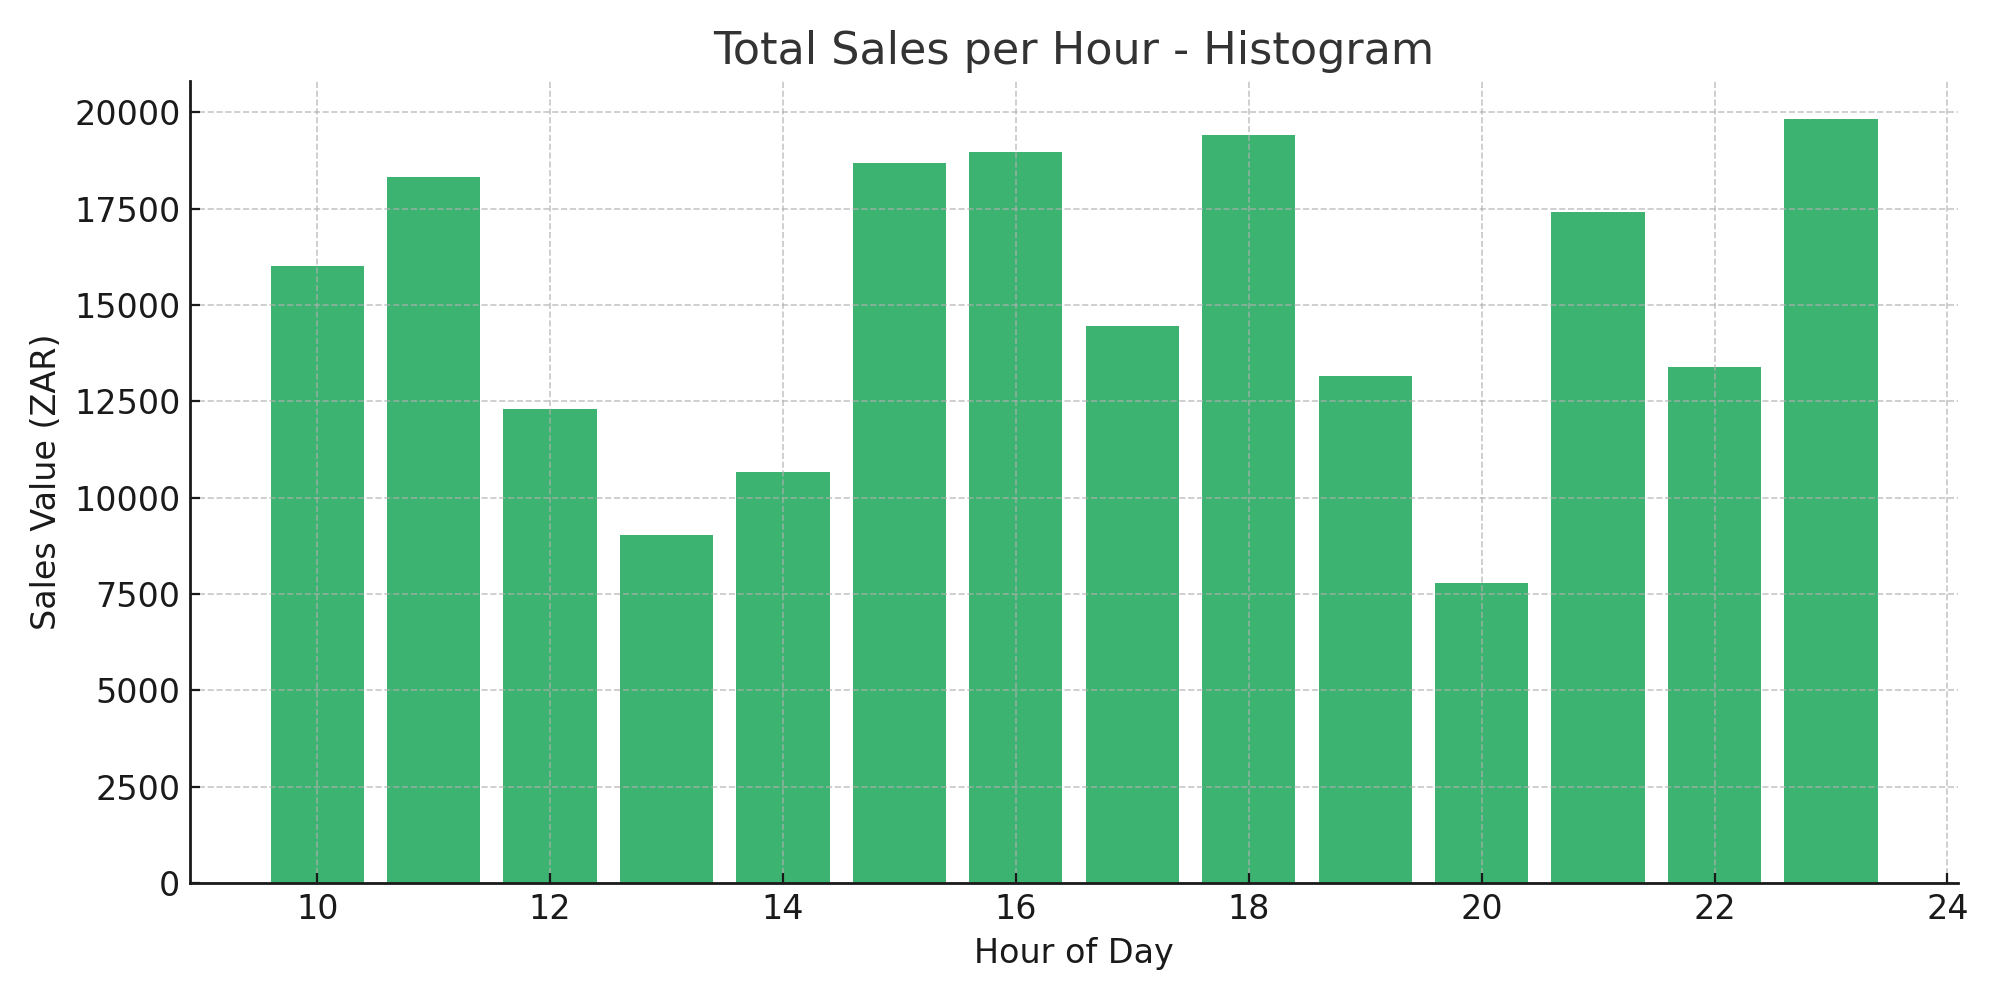
Total Sales per Hour
A time series chart of total sales over event days and hours.
How to use it:
- Identify peak sales periods for staffing, stocking, and scheduling promotions.
- Spot potential downtime opportunities for operational efficiency.
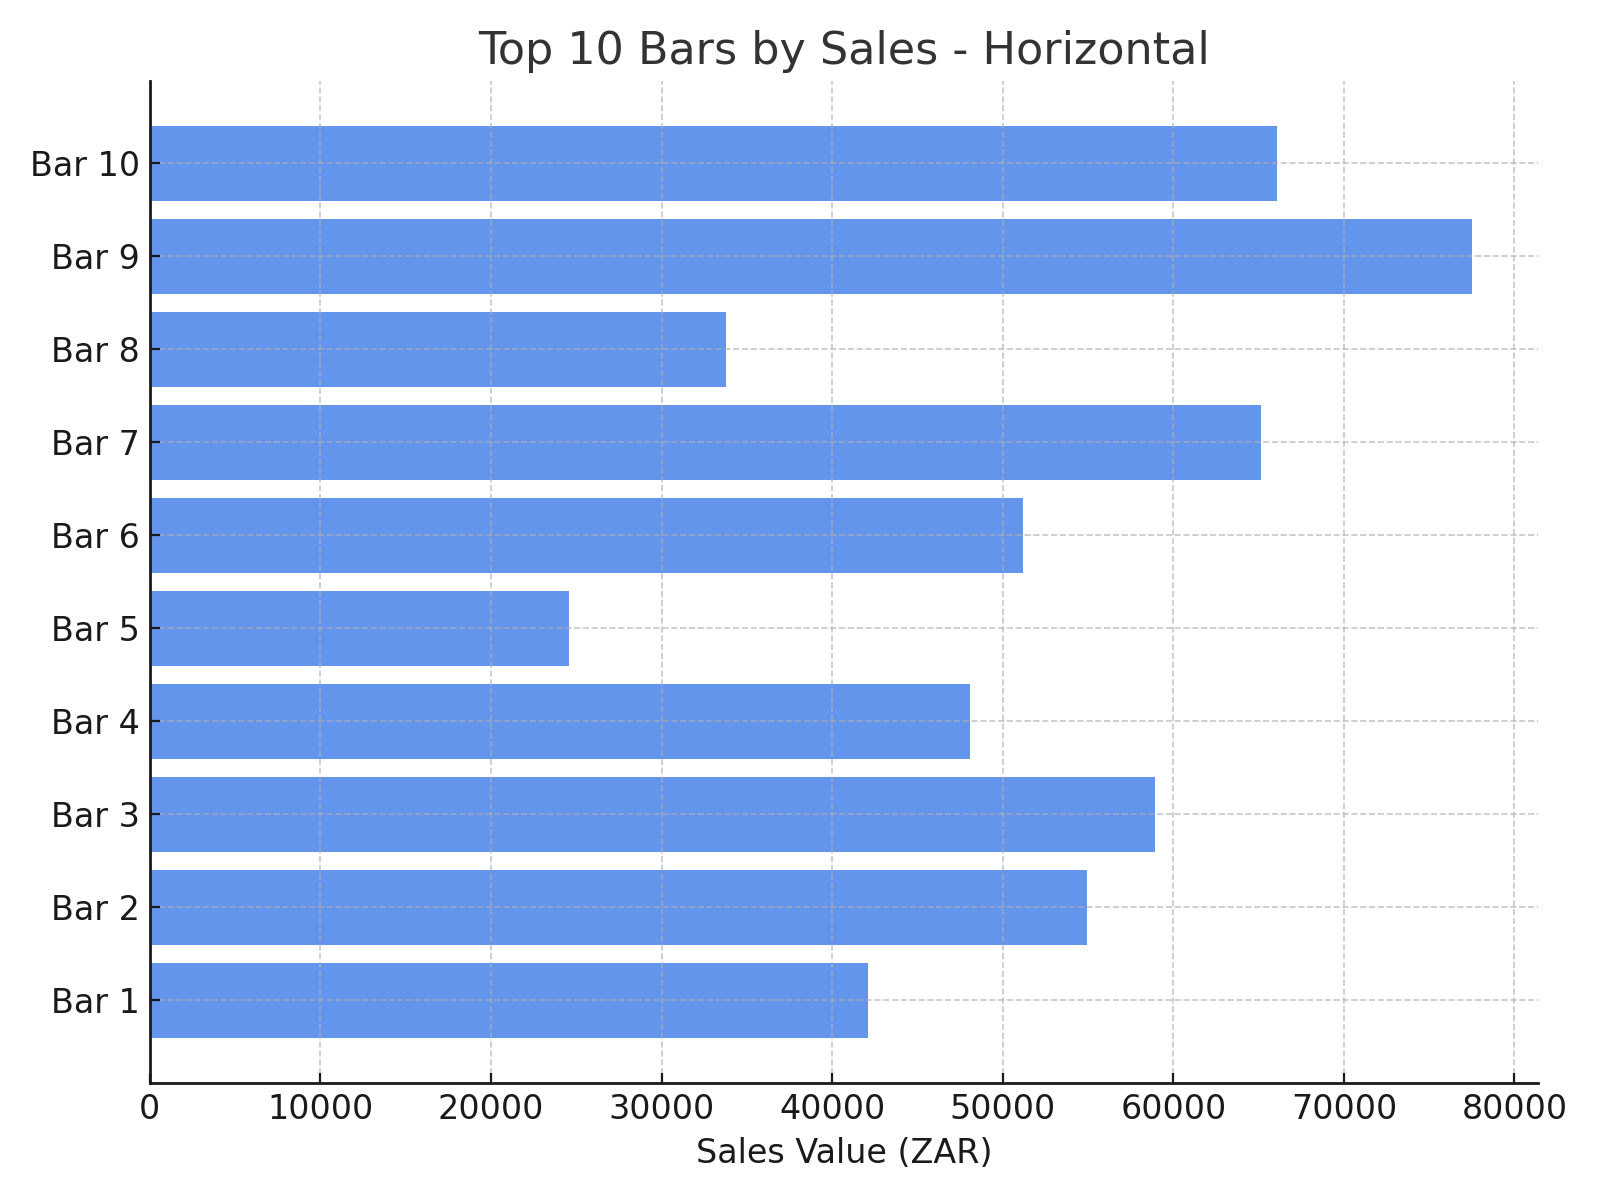
Top 10 Bars
A bar chart ranking the top 10 bars by total sales revenue.
How to use it:
- Assess which bar locations are driving the most revenue.
- Allocate resources to high-traffic areas.
- Adjust operational plans for underperforming outlets.
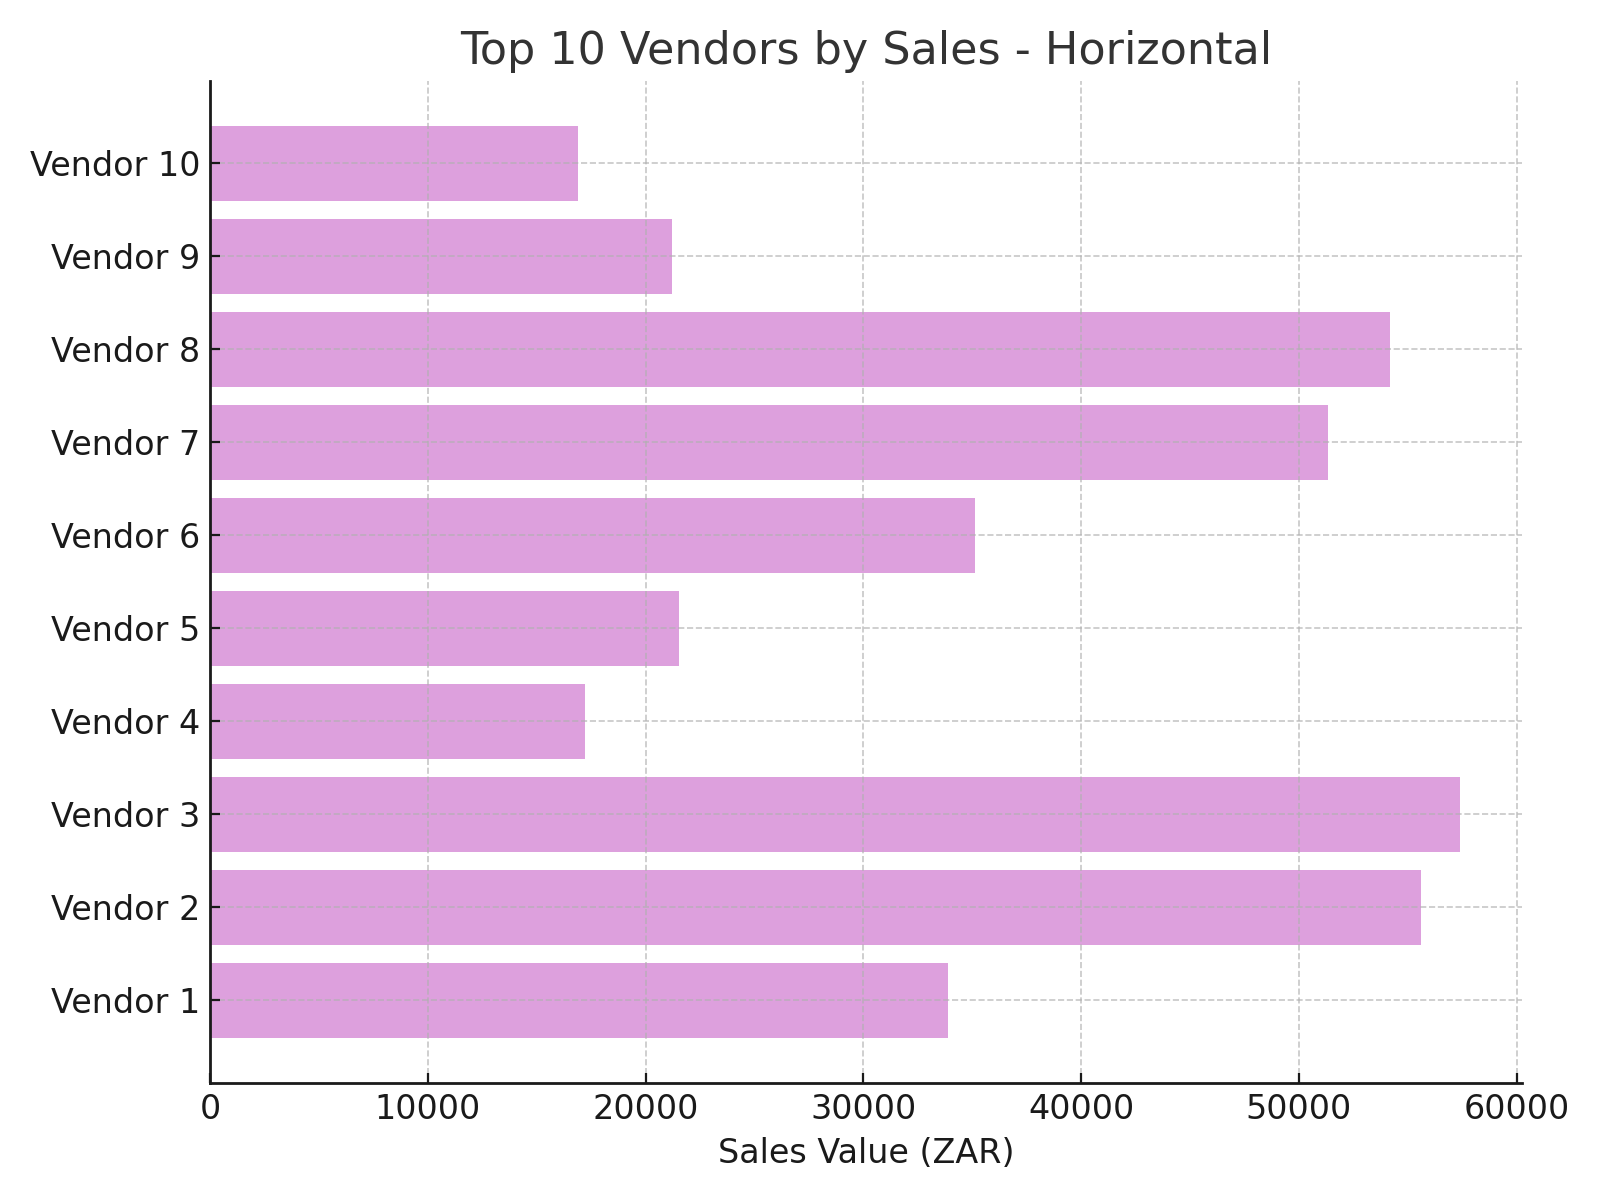
Top 10 Vendors
A bar chart ranking the top vendors based on average transaction value.
How to use it:
- Identify top performers among food and merchandise vendors.
- Use performance data to support vendor selection and renegotiations for future events.
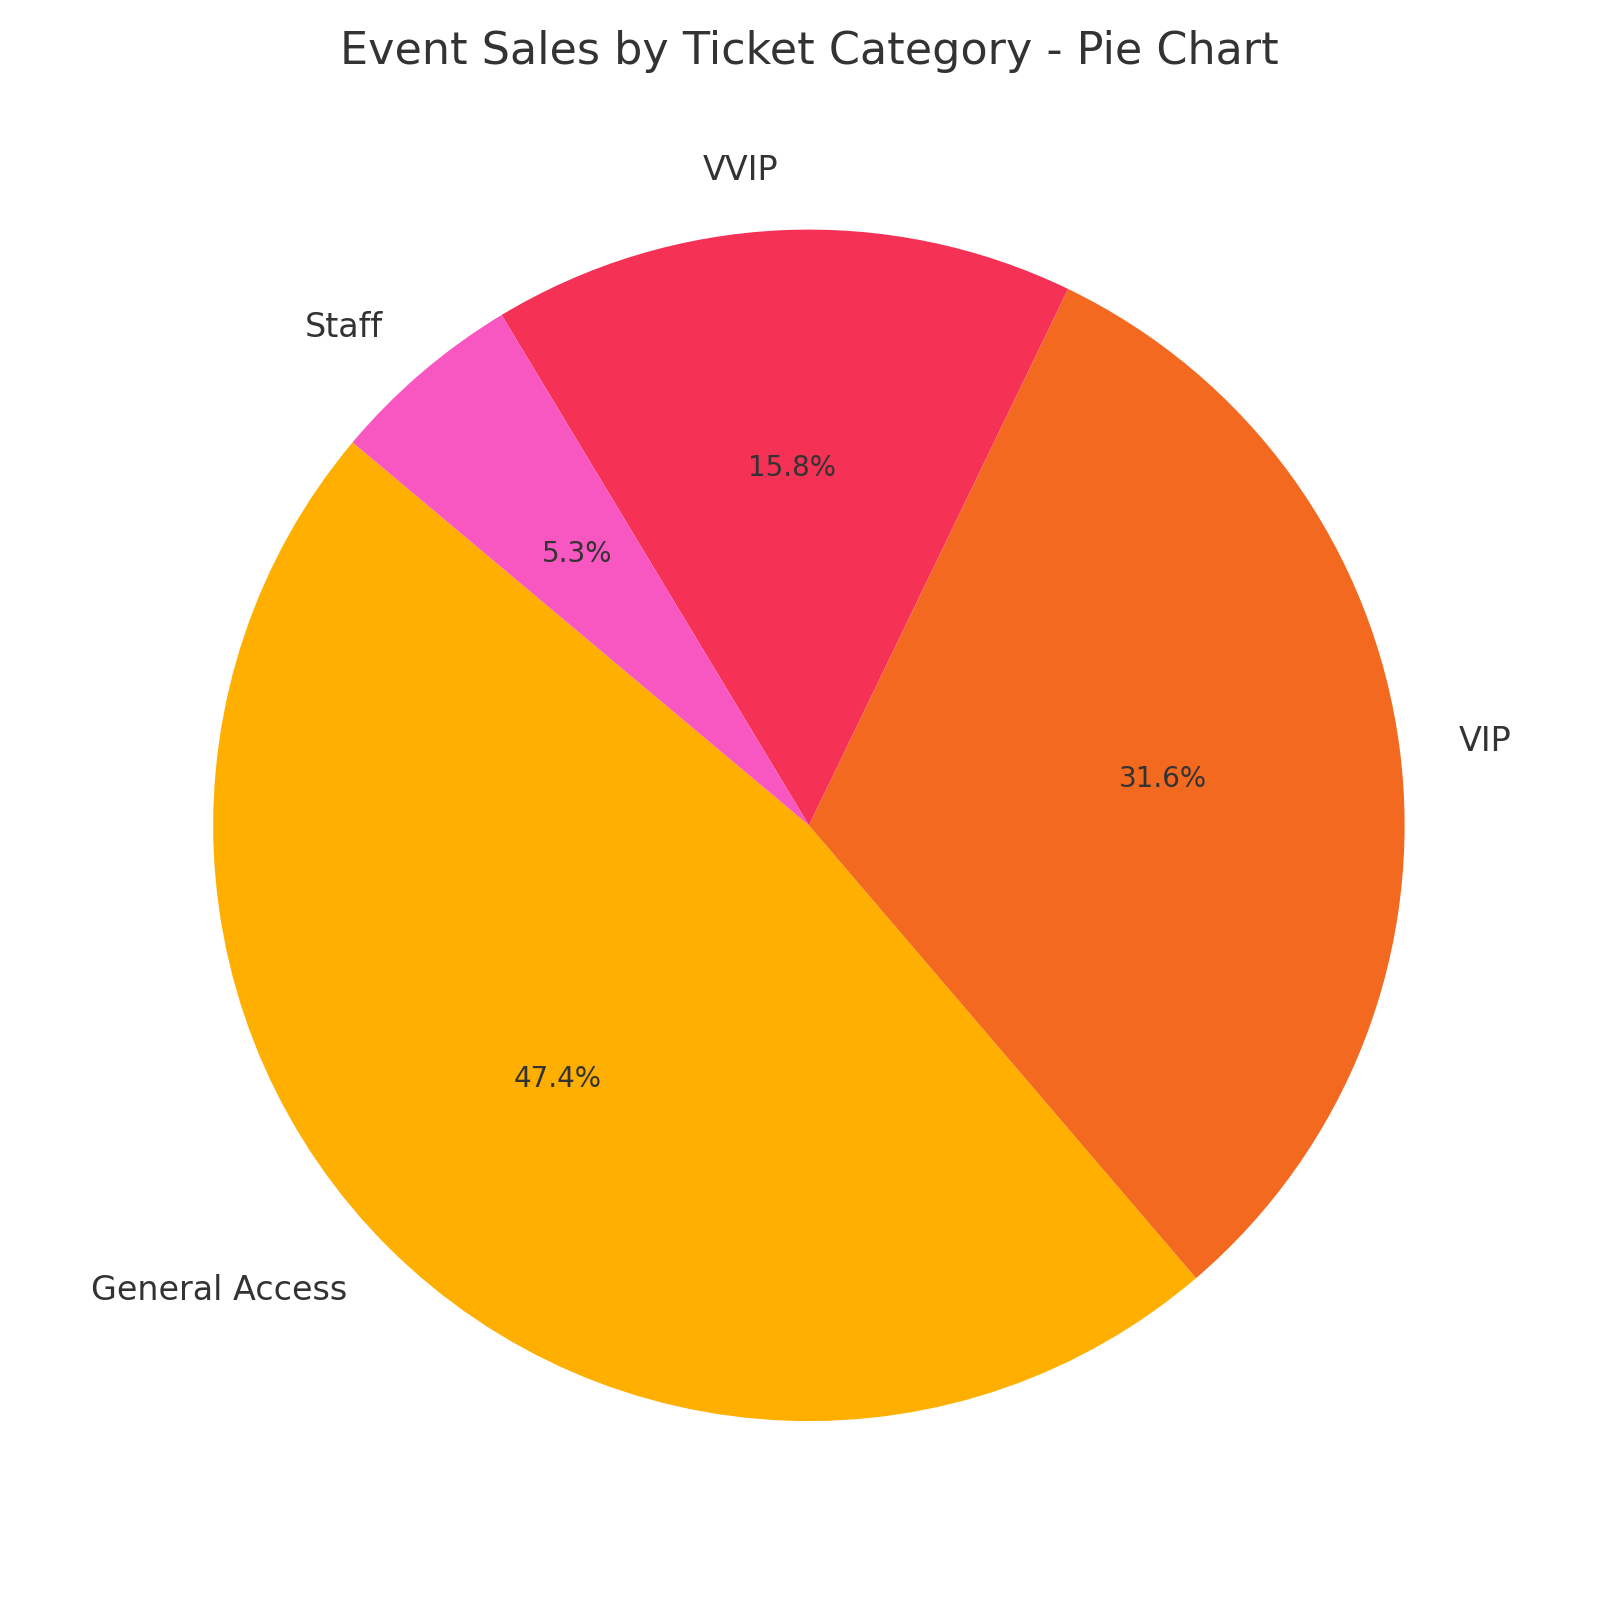
Event Sales by Ticket Category
A pie chart showing the percentage breakdown of event sales across ticket categories (e.g., GA, VIP).
How to use it:
- See which ticket categories are driving the most event revenue.
- Evaluate pricing strategies and event structure based on contribution by category.
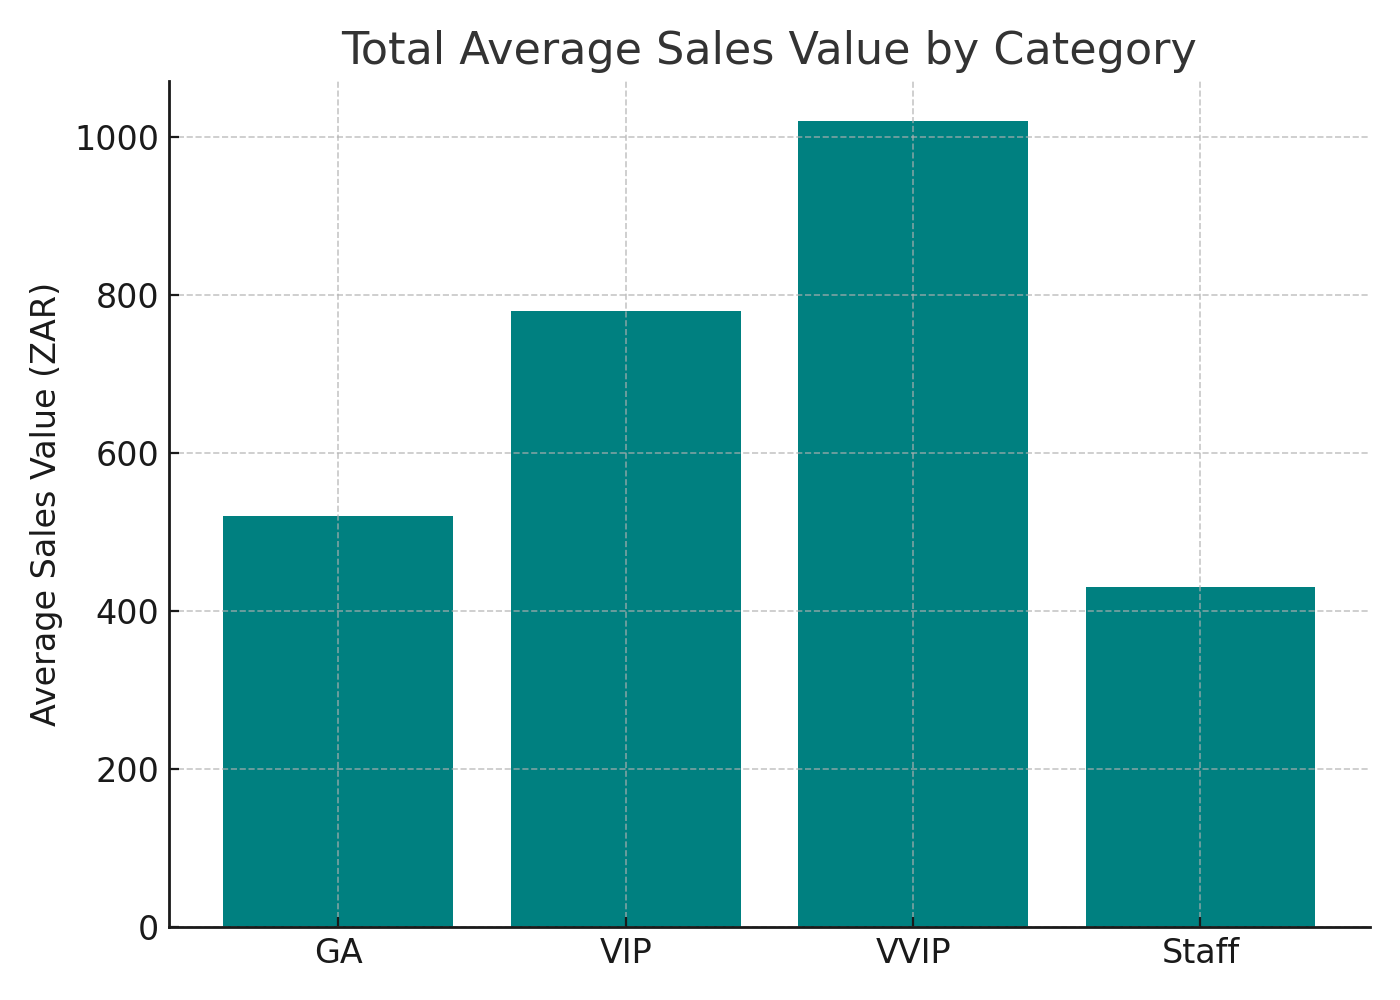
Total Average Sales Value by Category
A horizontal bar chart showing the average sales value generated per customer within each ticket category.
How to use it:
- Understand where the highest individual spend comes from.
- Prioritize experience enhancements and upselling efforts for high-spending categories.
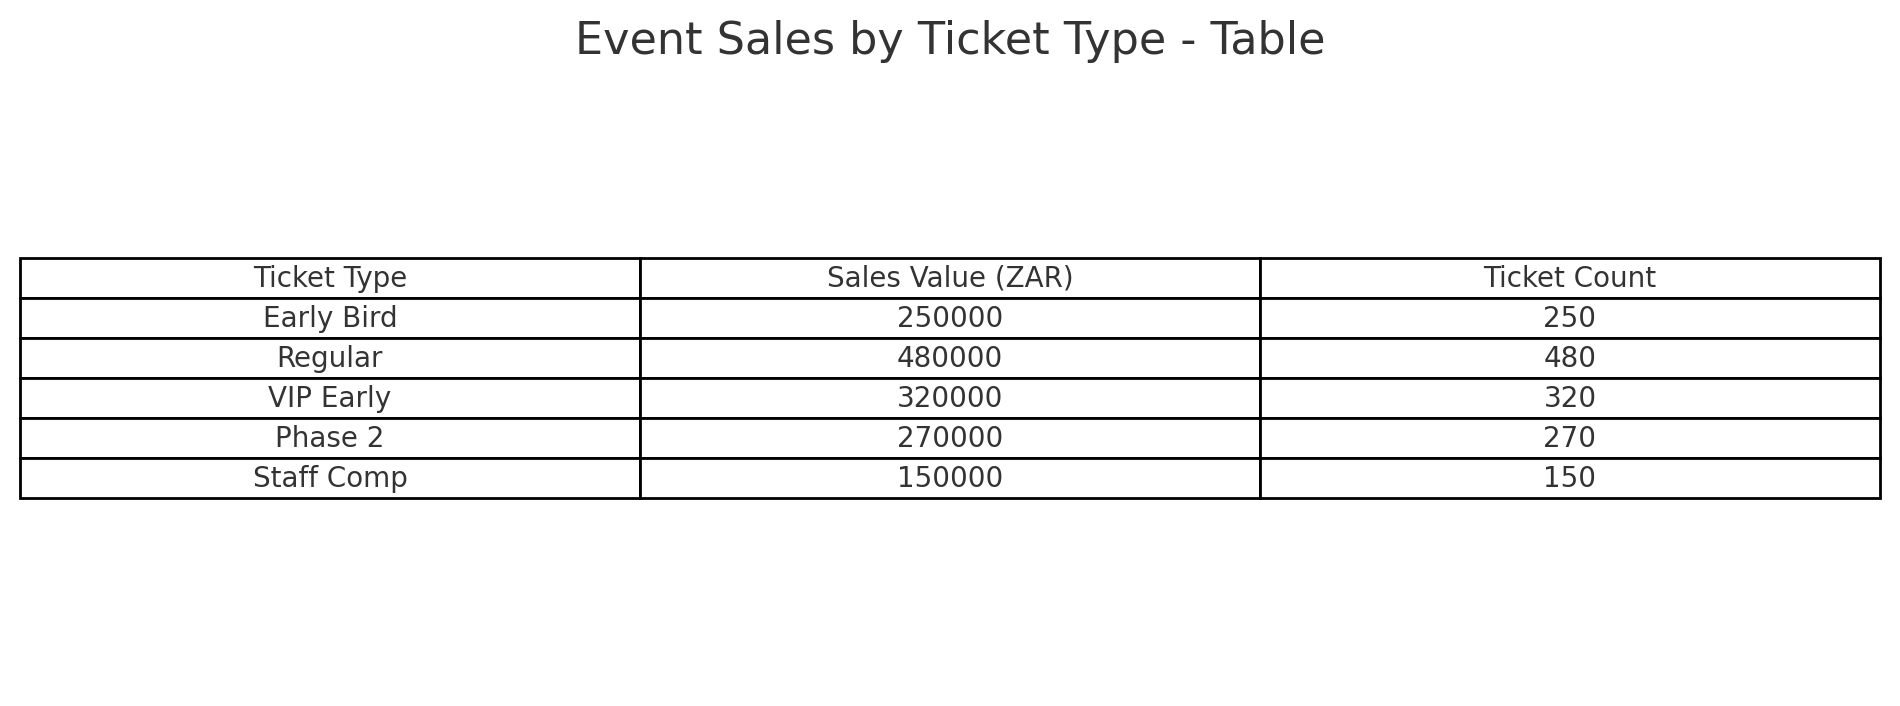
Event Sales by Ticket Type
A table with sale amount, item quantity, and transaction count for different ticket types.
How to use it:
- Pinpoint ticket types associated with higher transaction rates.
- Refine ticket packaging and pricing based on relative performance.
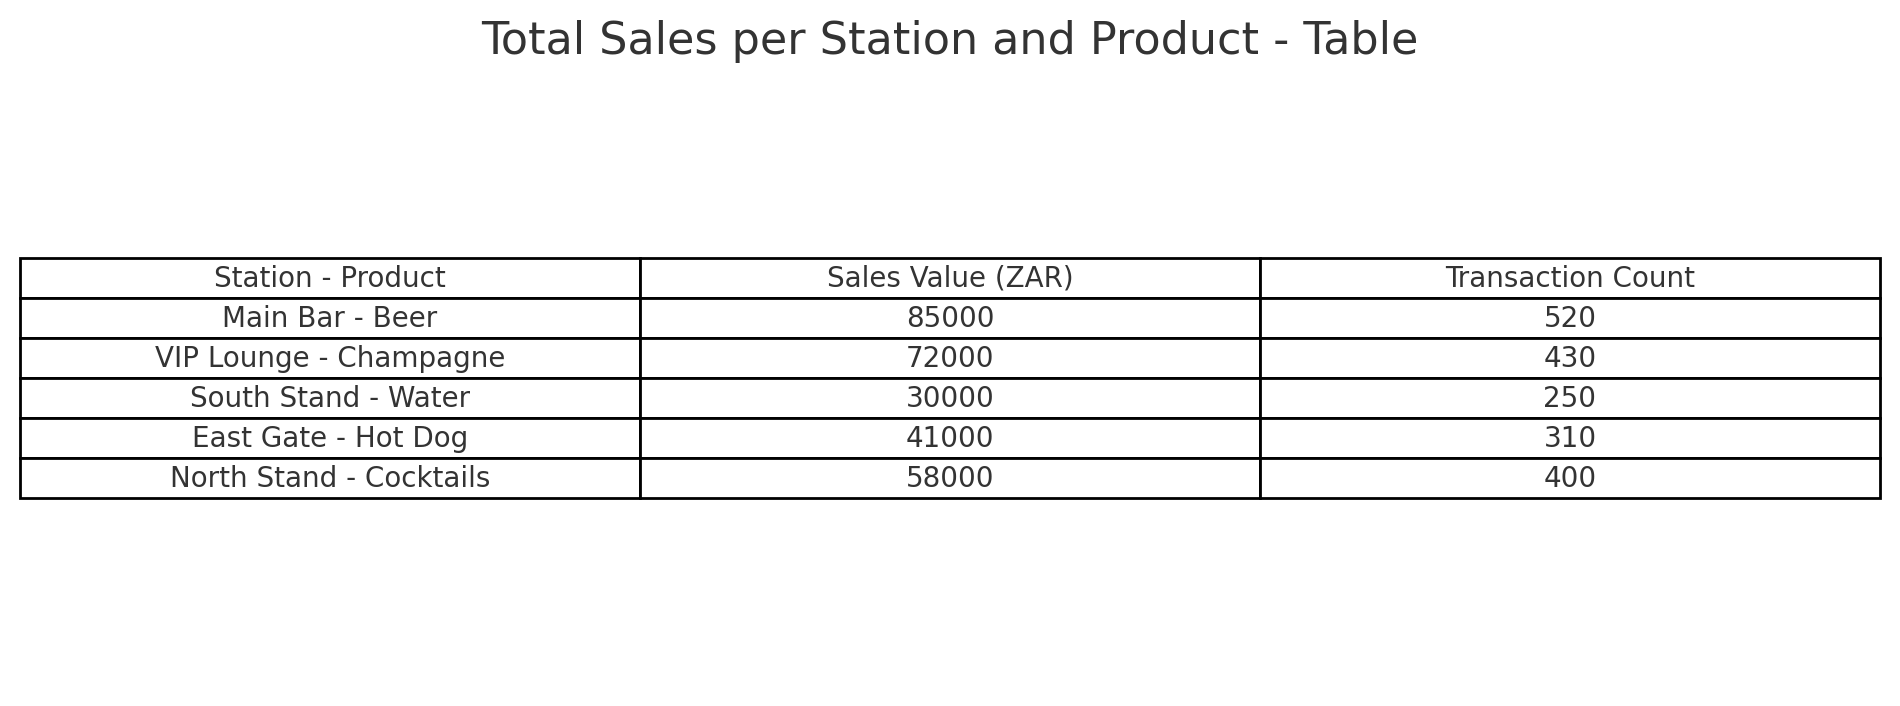
Total Sales per Station & Product
A table listing each station-product pairing, with sales amounts, transaction counts, and average transaction values.
How to use it:
- Evaluate which product and station combinations are most successful.
- Inform product bundling, positioning, and promotions.
Total Event Sales by Phase
A time-based view of total sales, ticket quantities, and customer counts segmented by months before the event.
How to use it:
- Assess purchasing behavior leading up to the event.
- Time marketing pushes and pricing adjustments for future sales cycles.