Dashboard Guide 1.2. Daily Sales Dashboard
 Updated
by Robyn Marais
Updated
by Robyn Marais
The Daily Sales Dashboard provides a real-time overview of ticket sales performance, revenue trends, and audience purchasing behavior for ongoing event campaigns. It is built to help event organisers monitor day-to-day activity, identify peak performance times, and understand customer purchasing patterns to make informed decisions and adjust strategies dynamically.
This dashboard is especially useful in the lead-up to an event, providing a high-level and granular view of ticket category performance, sales pacing, and hourly behavior.
This guide walks you through each key element of the dashboard to explain what the visuals represent and how to interpret the data effectively.
The dashboard enables you to:
- Monitor daily ticket sales, revenue, and order volumes at a glance.
- See when your customers are most likely to purchase, down to the hour and day.
- Identify dips or spikes in performance so you can adjust your marketing or sales efforts accordingly.
- Evaluate how promotions, announcements, or media coverage affect daily and weekly sales.
Days to go
At the top of the dashboard, you'll find a “Days to Go” figure to help orient the timeline view.
To ensure a like-for-like comparison between current and past events (even if their dates differ), adjust the “Days Before Event” filter to: is between [inclusive] the current days before value and 360. This aligns data points based on how many days remain before the event date to standardise comparison across events.
Key Metrics
Total Tickets: Total number of tickets sold to date.
Gross Ticket revenue: Total revenue generated from ticket sales.
Tickets Today: Number of tickets sold so far today (from 00:00). This includes a comparison to the previous day, indicating if the number is higher or lower than the day before.
Revenue Today: Revenue generated from today's ticket sales (from 00:00). This includes a comparison to the previous day, indicating if the number is higher or lower than the day before.
Orders Today: Total unique orders made today (from 00:00). This includes a comparison to the previous day, indicating if the number is higher or lower than the day before.
Weekly Sales Vs Previous: Tickets sold so far this week compared to the previous full week (Monday - Sunday)
Weekly Revenue Vs Previous: Revenue generated so far this week compared to last week (Monday - Sunday)
Categories Sold Today
This shows a breakdown of ticket categories (e.g., GA, VIP, VVIP) sold today, including:
- Ticket Count: How many tickets sold per category
- Revenue Contribution: The percentage of total revenue each category generated
Ticket Types Sold Today
Gives more detailed info on individual ticket types or tiers (e.g., “General Access – Early Bird”).
Why it matters: This section helps you understand which ticket types are most popular or underperforming.
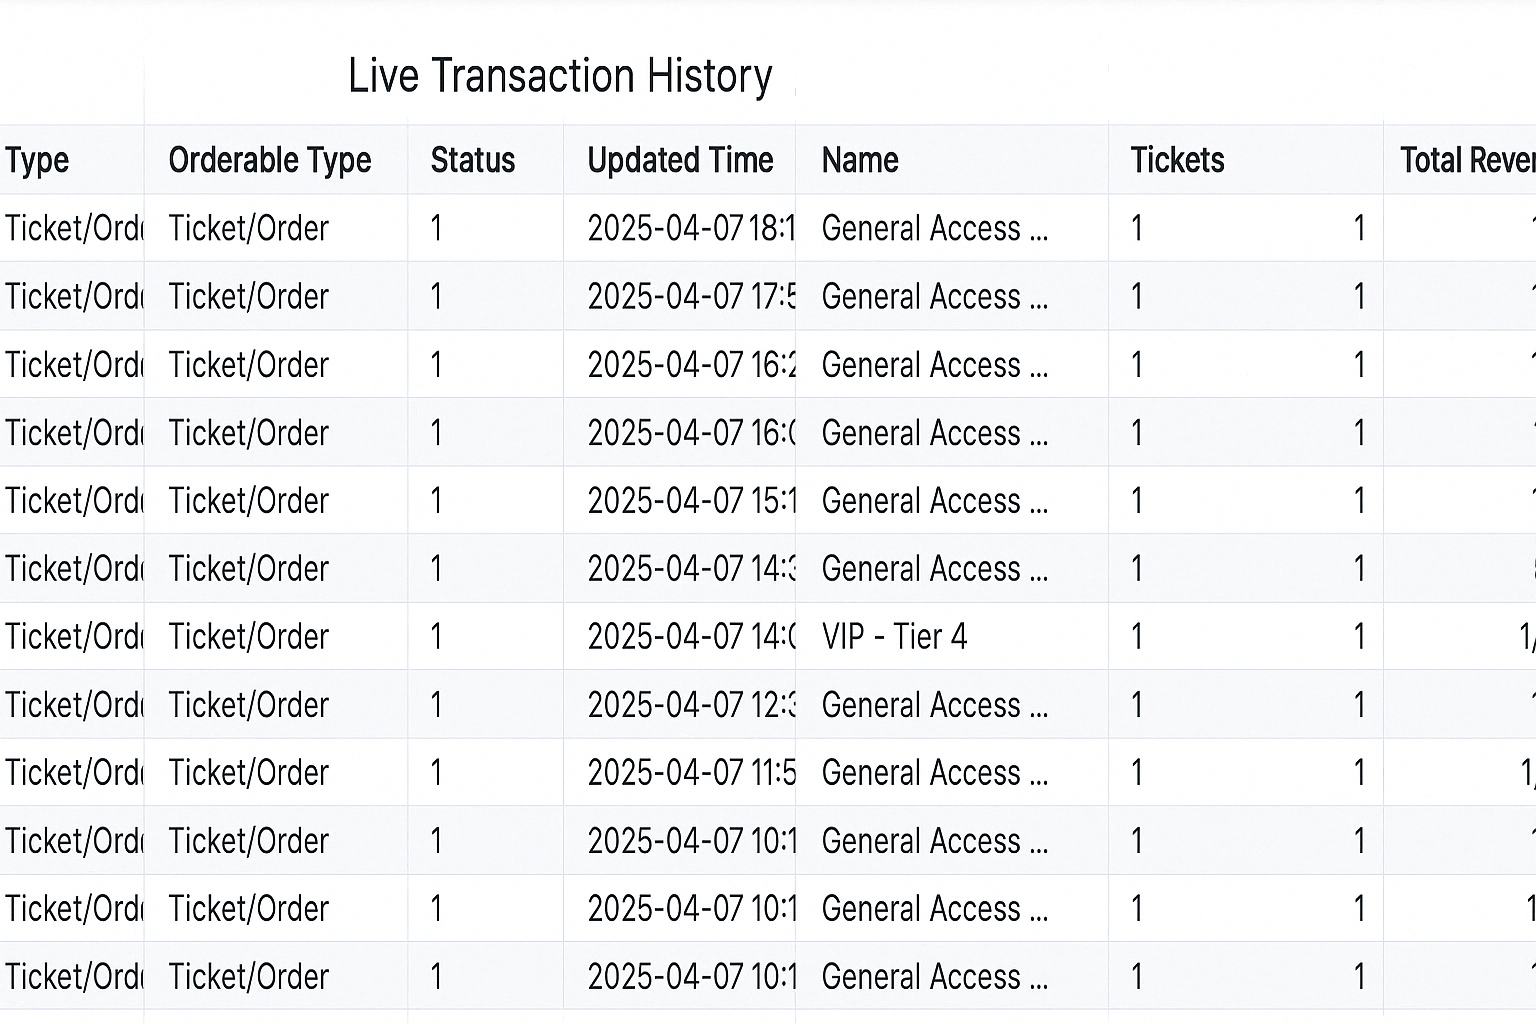
Live Transaction History
This table displays real-time ticket transaction data, including customer details, ticket type, quantity, revenue generated, and timestamp of the latest update. How to use it:
- Monitor ticket sales activity as it happens.
- Quickly track customer purchases, ticket types, and revenue contributions.
- Identify recent sales trends and operational activity.
Cumulative Tickets per Hour - Last 3 Days
Shows hourly ticket sales trends over the past 3 days.
How to use it:
- Identify the times of day when buyers are most active
- Optimize marketing pushes or paid campaigns around these high-activity windows
Weekly Ticket Sales
Tracks your total sales and revenue week-by-week.
Why it's useful:
- Compare performance across weeks
- Measure progress against goals or benchmarks
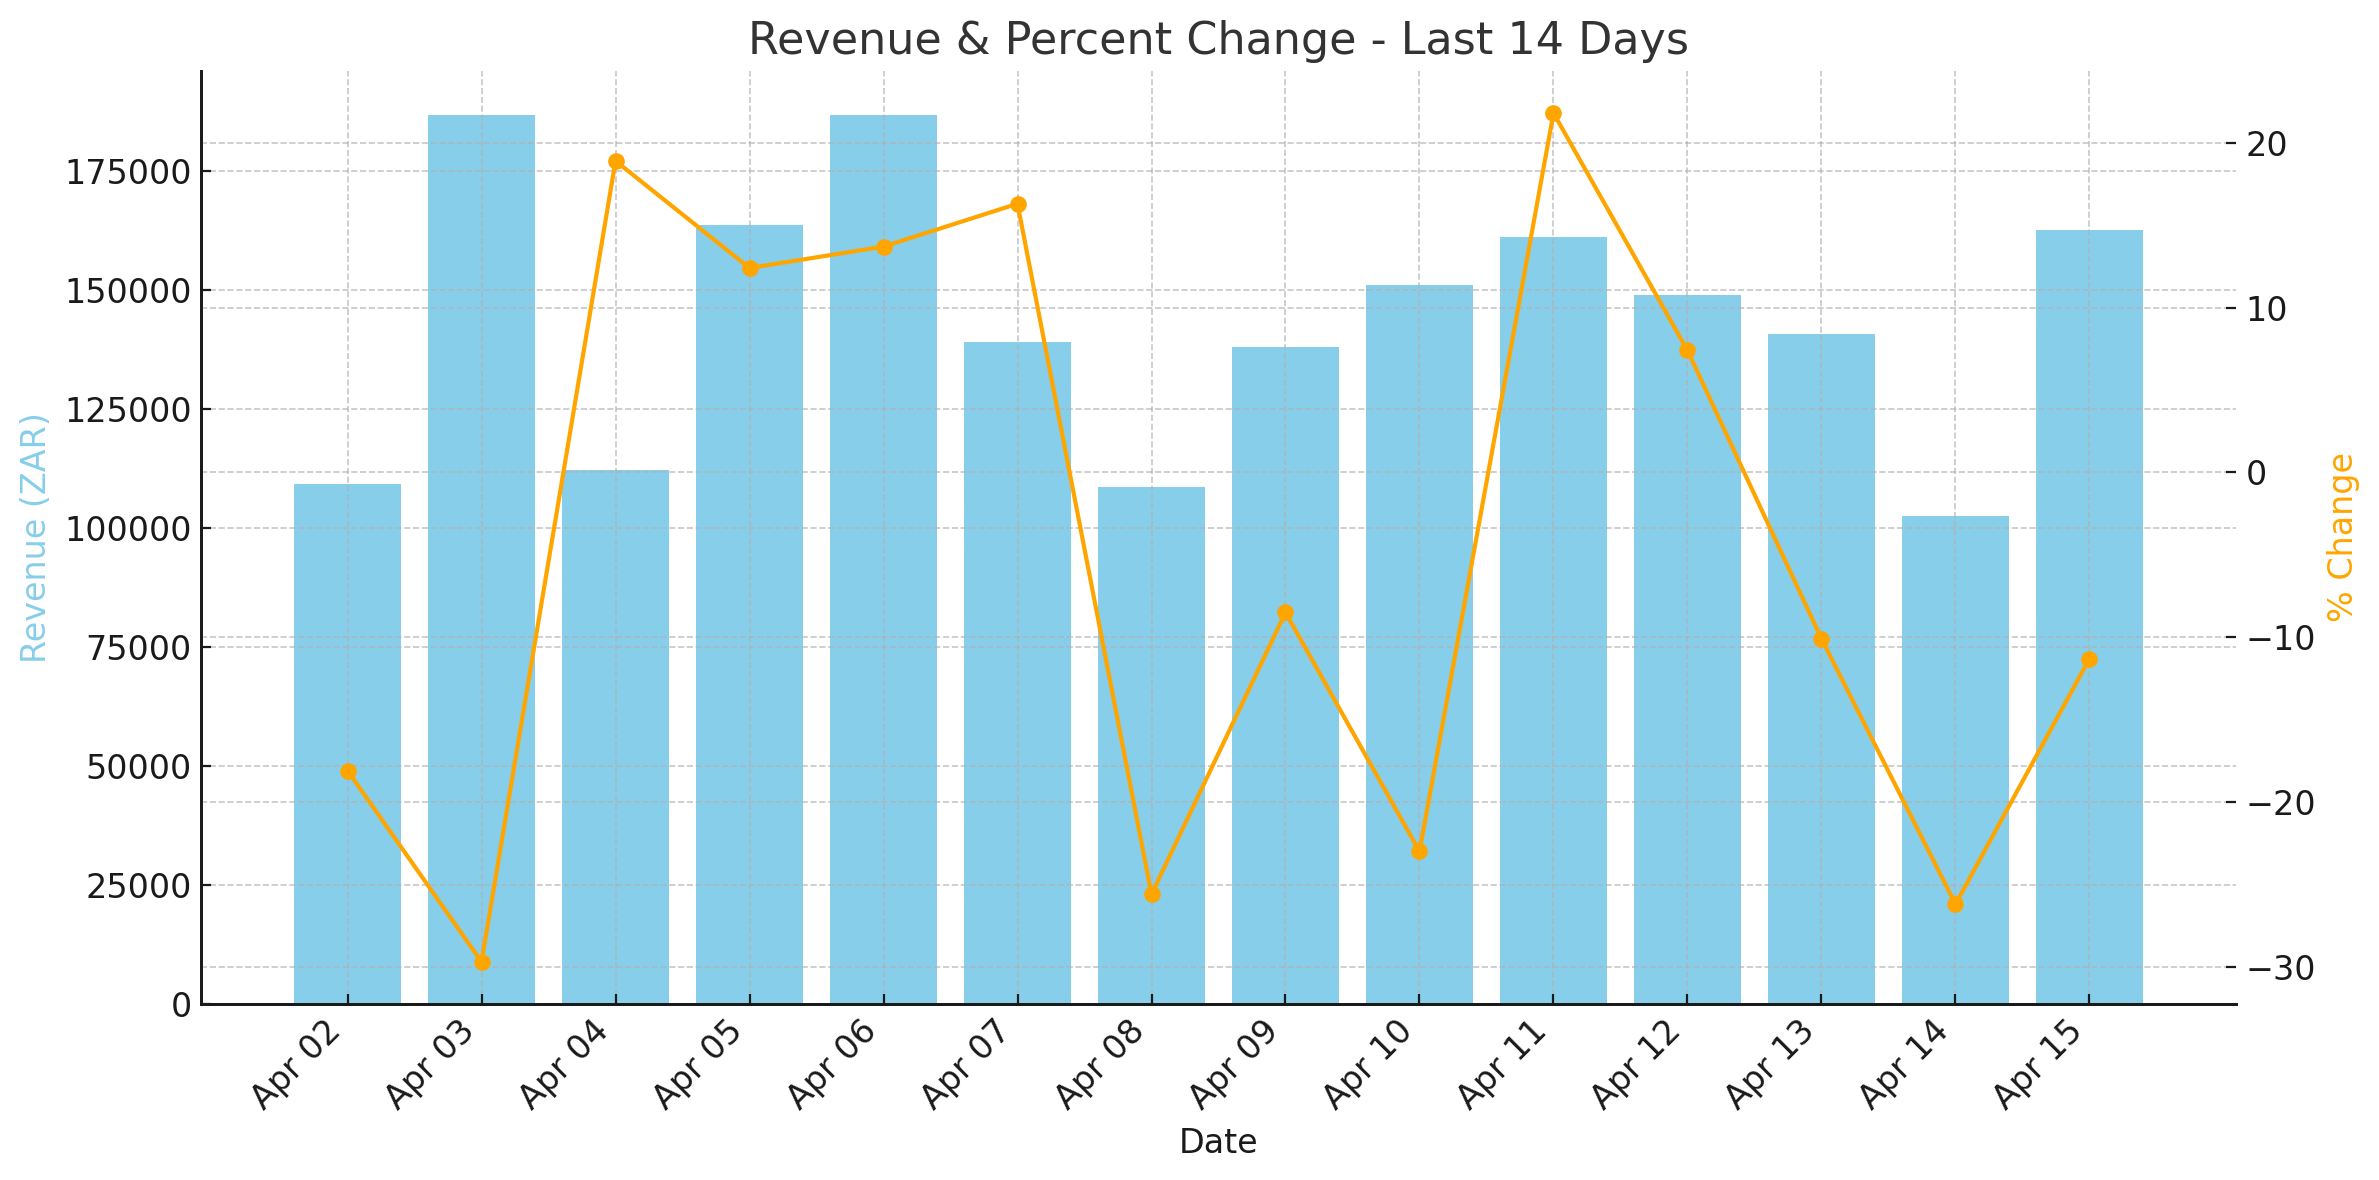
Revenue Sales - Last 14 Days
Visual representation of daily revenue and its percent change from the previous day over the last two weeks.
Key uses:
- Spot daily sales surges or slumps
- Assess the impact of promotions or announcements
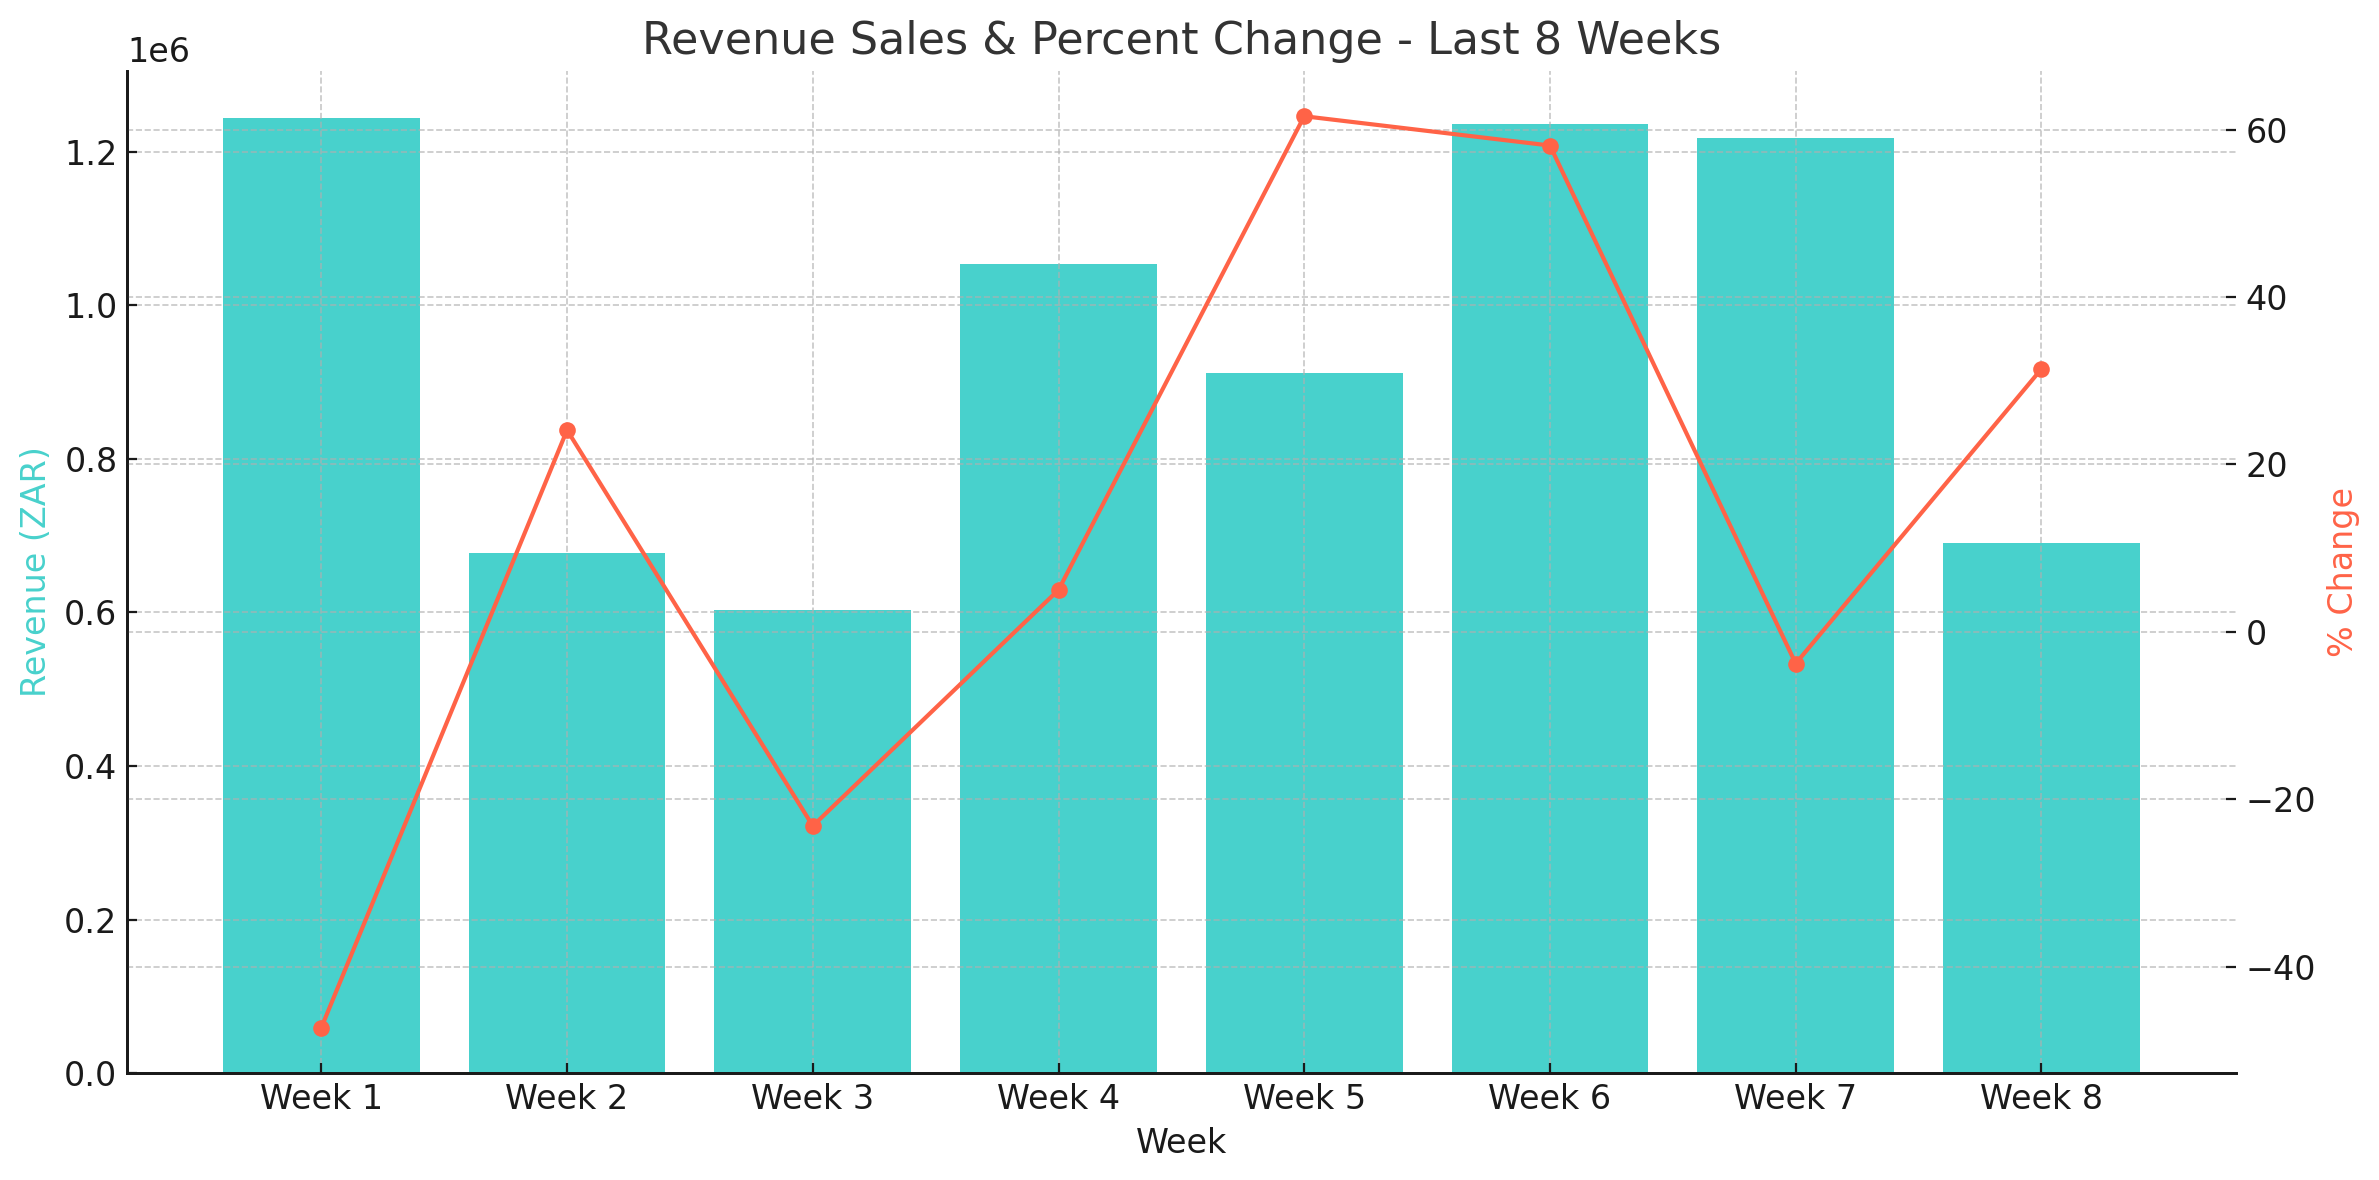
Revenue Sales - Last 8 Weeks
Visual representation of weekly revenue and its percent change from the previous day over the last two weeks.
Key uses:
- Spot daily sales surges or slumps
- Assess the impact of promotions or announcements
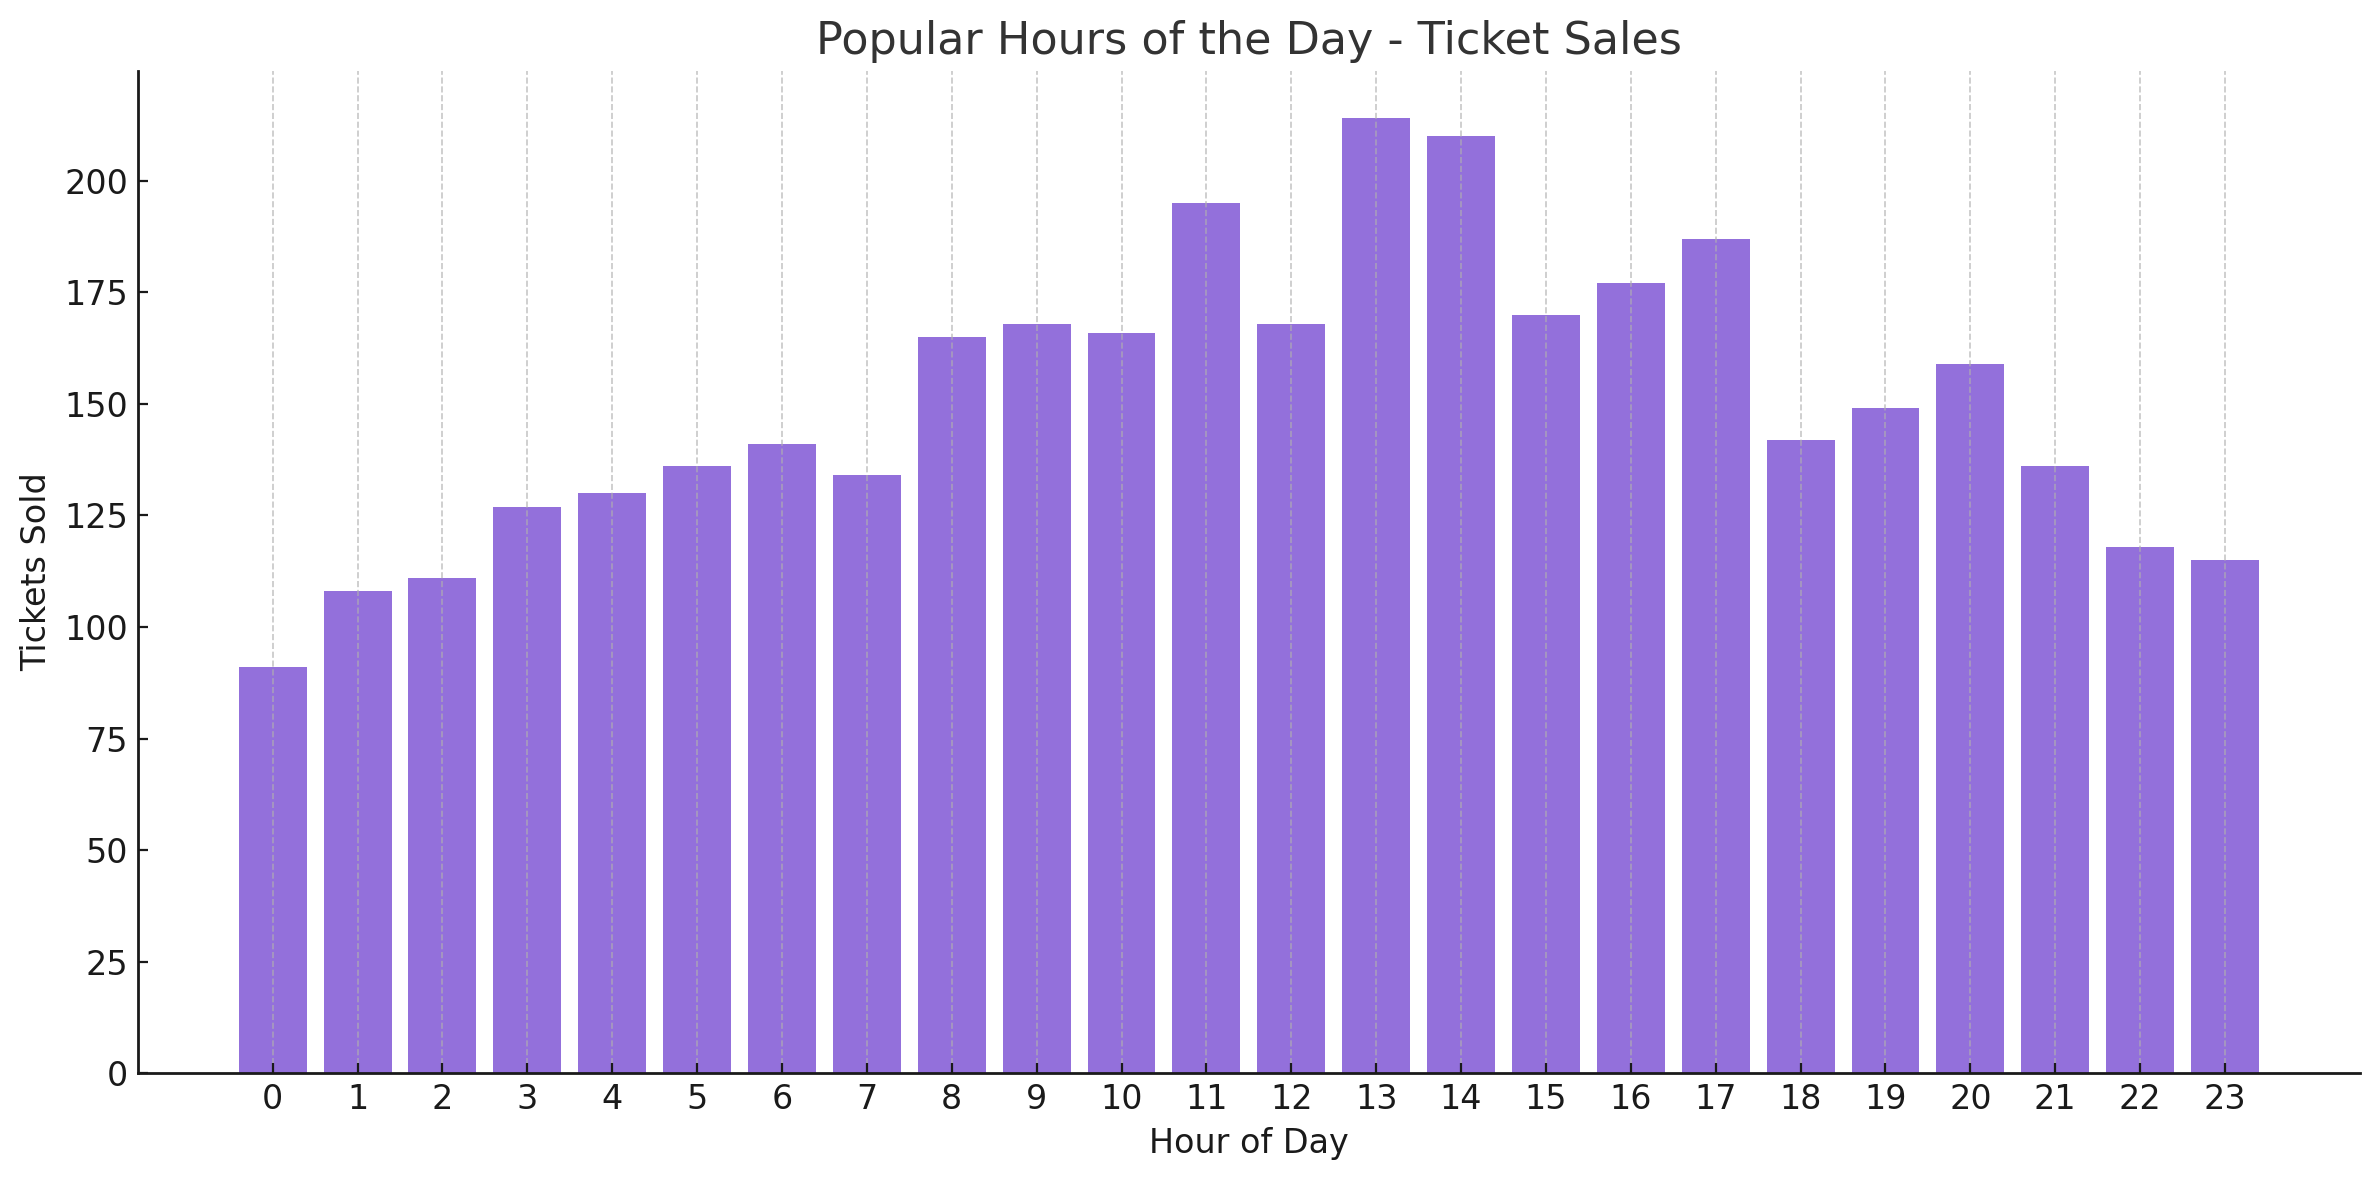
Popular Hours of the Day - Ticket Sales
Displays the hours when most tickets are purchased.
Example insight: If you see sales spike between 9AM–11AM, you might want to send email campaigns just before that window.
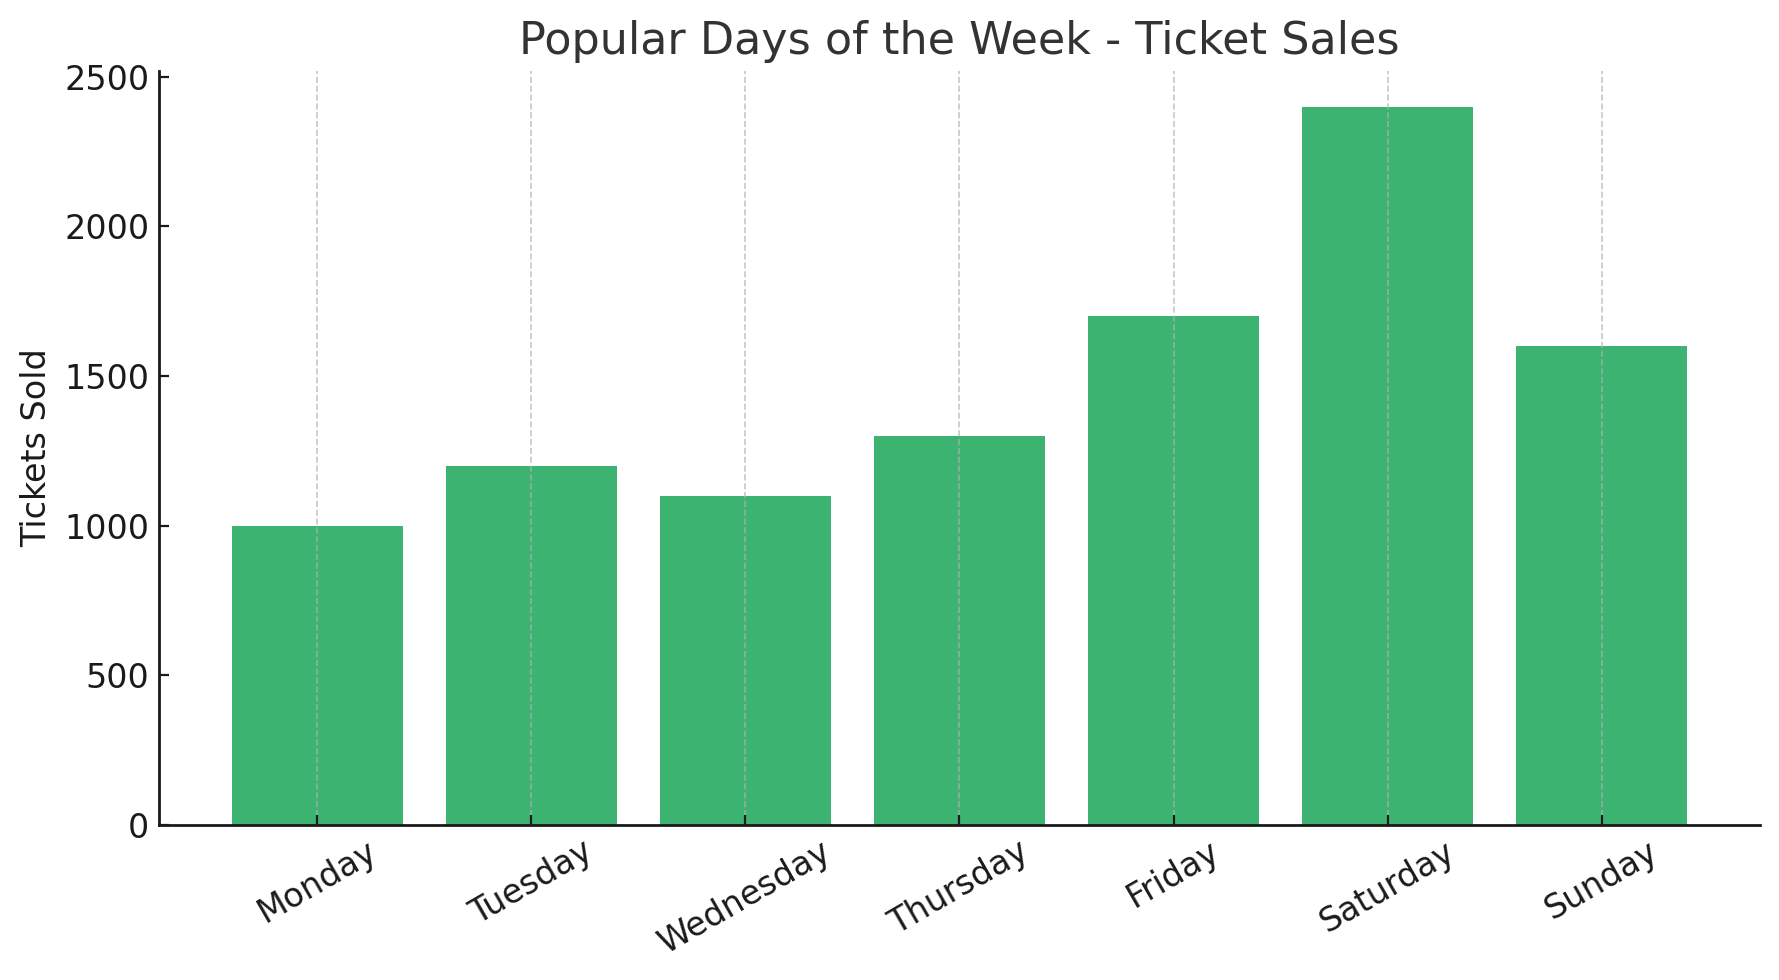
Popular Days of the Week - Ticket Sales
Helps you understand which weekdays drive the most purchases.
Tip: Use this data to schedule marketing campaigns for high-performing days.
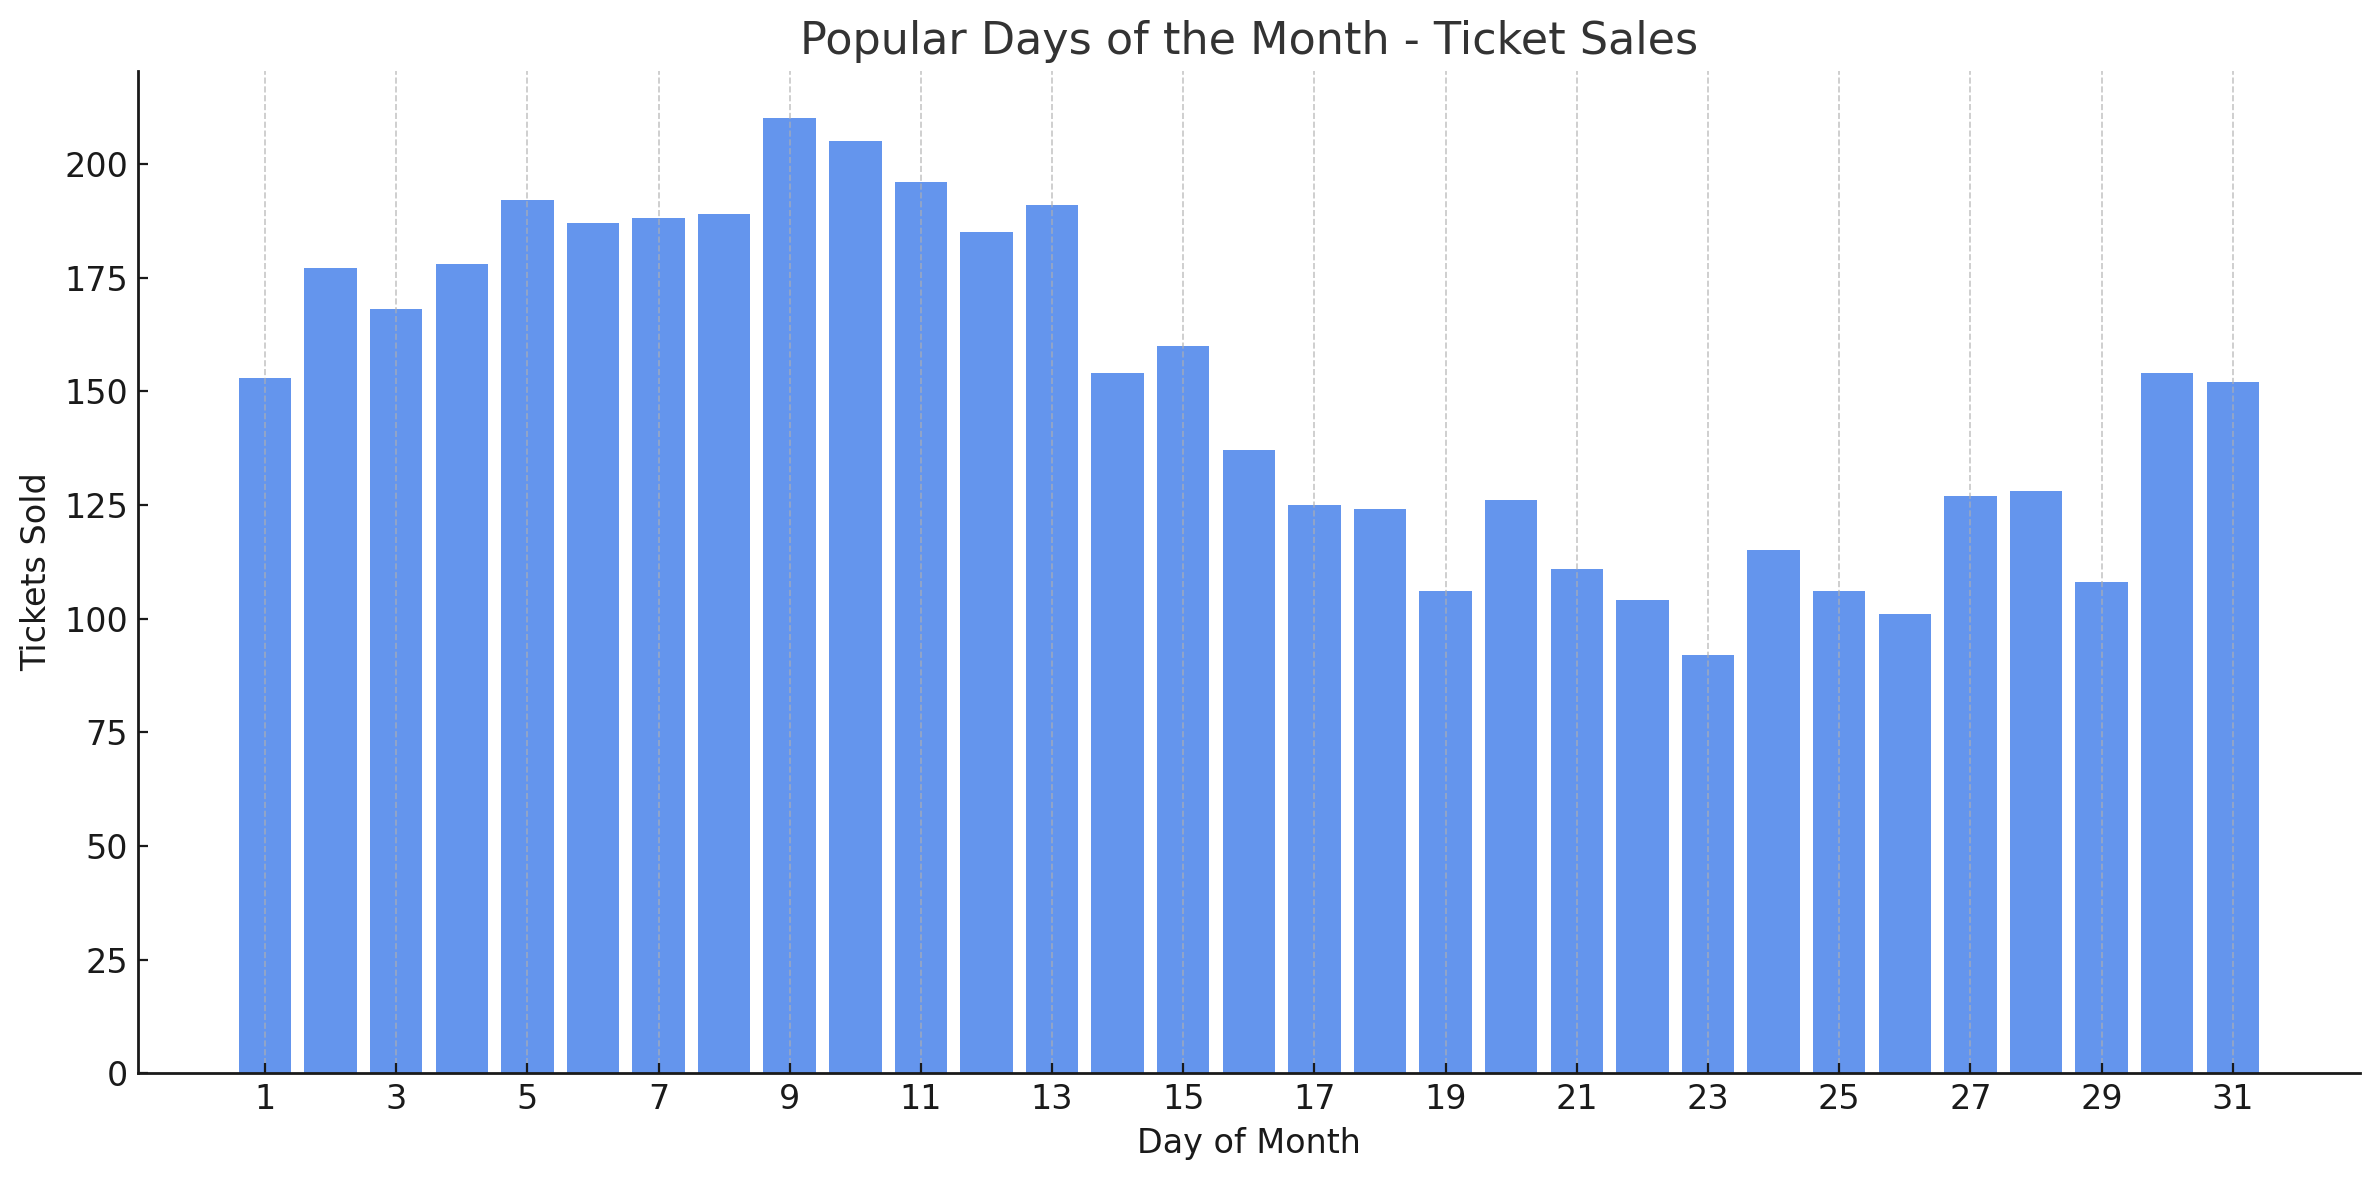
Popular Days of the Month - Ticket Sales
See which dates within a typical month generate the most ticket sales.
Identify if customers are purchasing tickets at the beginning of the month, end of the month or somewhere in the middle.
🙋 FAQs
Q: Does this dashboard include complimentary tickets?
A: No – it only tracks paid tickets unless the filter on the dashboard is set to include complimentary tickets.
Q: Are refunds deducted?
A: Refunded tickets are typically excluded from totals, only active tickets are included in sales metrics.
Q: Can I compare this with previous events?
A: For Year-on-Year or multi-event comparisons, refer to the Ticketing YoY Analysis Dashboard.