Attending An Event
Account Settings
Billing and Payment
Account Settings
Delete Your Account
Link Facebook or Google
ID or Passport Number Not Valid
Edit Details on Your Profile
Privacy and Security
Tickets
Cashless
Howler Active
Organising An Event
Getting Started
Video Tutorial - Getting Started
Organiser Approval Process
Getting Started with Howler
Our Services
Getting Paid
Howler Customer Support
Payment Gateway Options - For organisers
Manage your account
Setup your event
How to create an event
How to Make My Event Searchable on Howler.co.za
Event Look and Feel
Ticket Type Settings
How to enable donations for your event
Express Checkin
Enable Ticket Resale for your Event
Marketing Tools
Ticket Reps
How to drive ticket sales
Ticket Bundles and Specials
Issue Complimentary Tickets
Custom Ticket Type Links
Marketing Tools - Sending an email campaign
Marketing Tools - Sending an SMS campaign
Setting Up Google Analytics Tracking
Integrating the Facebook Pixel
Howler Brand/CI/Style Guide
Embedded links
Create a QR code linking to your ticketing page
Sponsor Assigning Complimentary Tickets
Event Customisation
Event Page Customisation within the organiser portal
Premium Event Customisation
How to Optimize an Image
Going Cashless
Going Cashless with Howler
Howler RFID Wristband Design Template
Vendor fees - For organisers
Cashless Sales Reports
How to drive Online Topups for a Cashless event.
Cashless Customer Journey
Ticket Scanning
Reporting
Event Protect
Howler Backend - Active Admin
Howler Backend Active Admin
Howler Backend Active Admin - Manage Organiser Roles
Howler Backend Active Admin - Reps
Howler Backend Active Admin - GTM configuration
Howler Backend Active Admin - Create Ticket Types
Howler Backend Active Admin - Promo Codes
Howler Backend Active Admin - Create a Pre Registration Event
Howler Backend Active Admin - Unique Registration
Howler Backend Active Admin - Data Capture
Streaming Online Events
How to create an Online Streaming Event
How to enable Express Check-in for your event
Finding your stream URL
How to schedule a Facebook Live video stream - Using your computer
How to start a Facebook Live video stream - Using your mobile device
How to setup a private Zoom web conference
Pulse
Dashboard Guide 1.1. Ticketing Overview YoY Analysis
Dashboard Guide 1.2. Daily Sales Dashboard
Dashboard Guide 1.3. Ticket Type YoY Analysis
Dashboard Guide 1.4. Price YoY Analysis
Dashboard Guide 1.5. Payment YoY Analysis
Dashboard Guide 4. Audience YoY Analysis
Dashboard Guide 5. Abandoned Cart
Dashboard Guide 6.1.1. Event Sales Overview
Dashboard Guide 6.1.3. Bar Sales
Dashboard Guide 6.1.5. Event Sales Demographics
Dashboard Guide 6.3.1. Total Topups Overview YoY Analysis
Dashboard Guide 6.3.4. Total Topup Ticket Type YoY Analysis
Dashboard Guide 6.3.5. Total Topup Demographic
Dashboard Guide 6.1.4. Vendor Sales
Dashboard Guide 6.2. Cashless Check-Ins Dashboard
Dashboard Guide 6.1.6 Event Sales Ticket Type Analysis
Dashboard Guide 6.3.3. Onsite Topups YoY Analysis
Dashboard Guide 6.3.2. Online Topups YoY Analysis
Vendor at an event
Setting Up Your Vendor Account
Setting Up For An Event
Setting Up Your Menu
Editing Vendor Bank Details
How to use the Howler Cashless Point of Sales Devices - Training Video
Vendor Fees
Vendor Settlement
The Vendor Agreement
Vendor Sales Reports
Legal
Partners Resources
- All Categories
- Organising An Event
- Pulse
- Dashboard Guide 5. Abandoned Cart
Dashboard Guide 5. Abandoned Cart
 Updated
by Robyn Marais
Updated
by Robyn Marais
This dashboard provides a detailed view of abandoned ticket purchases — cases where users started but did not complete a ticket transaction. Understanding abandoned carts is critical for improving conversion rates, optimising user experience, and targeting recovery campaigns (e.g., retargeting emails or SMS reminders).
This guide walks you through each key element of the dashboard to explain what the visuals represent and how to interpret the data effectively.
The dashboard enables you to:
- Track the number and potential value of abandoned ticket purchases.
- Understand abandonment patterns by ticket type, ticket category, location, demographic, and time.
- Identify segments (e.g., cities, age groups) with higher drop-off rates.
- Prioritise recovery campaigns to target high-value abandoned carts.
- Plan marketing interventions (email, SMS) for cart recovery.
Key Metrics
Abandoned Ticket Revenue: The total potential revenue lost due to abandoned ticket purchases.
Total Count of Abandoned Tickets: The number of individual tickets that were abandoned (not purchased).
Total Count of Users: The number of unique users who abandoned a cart.
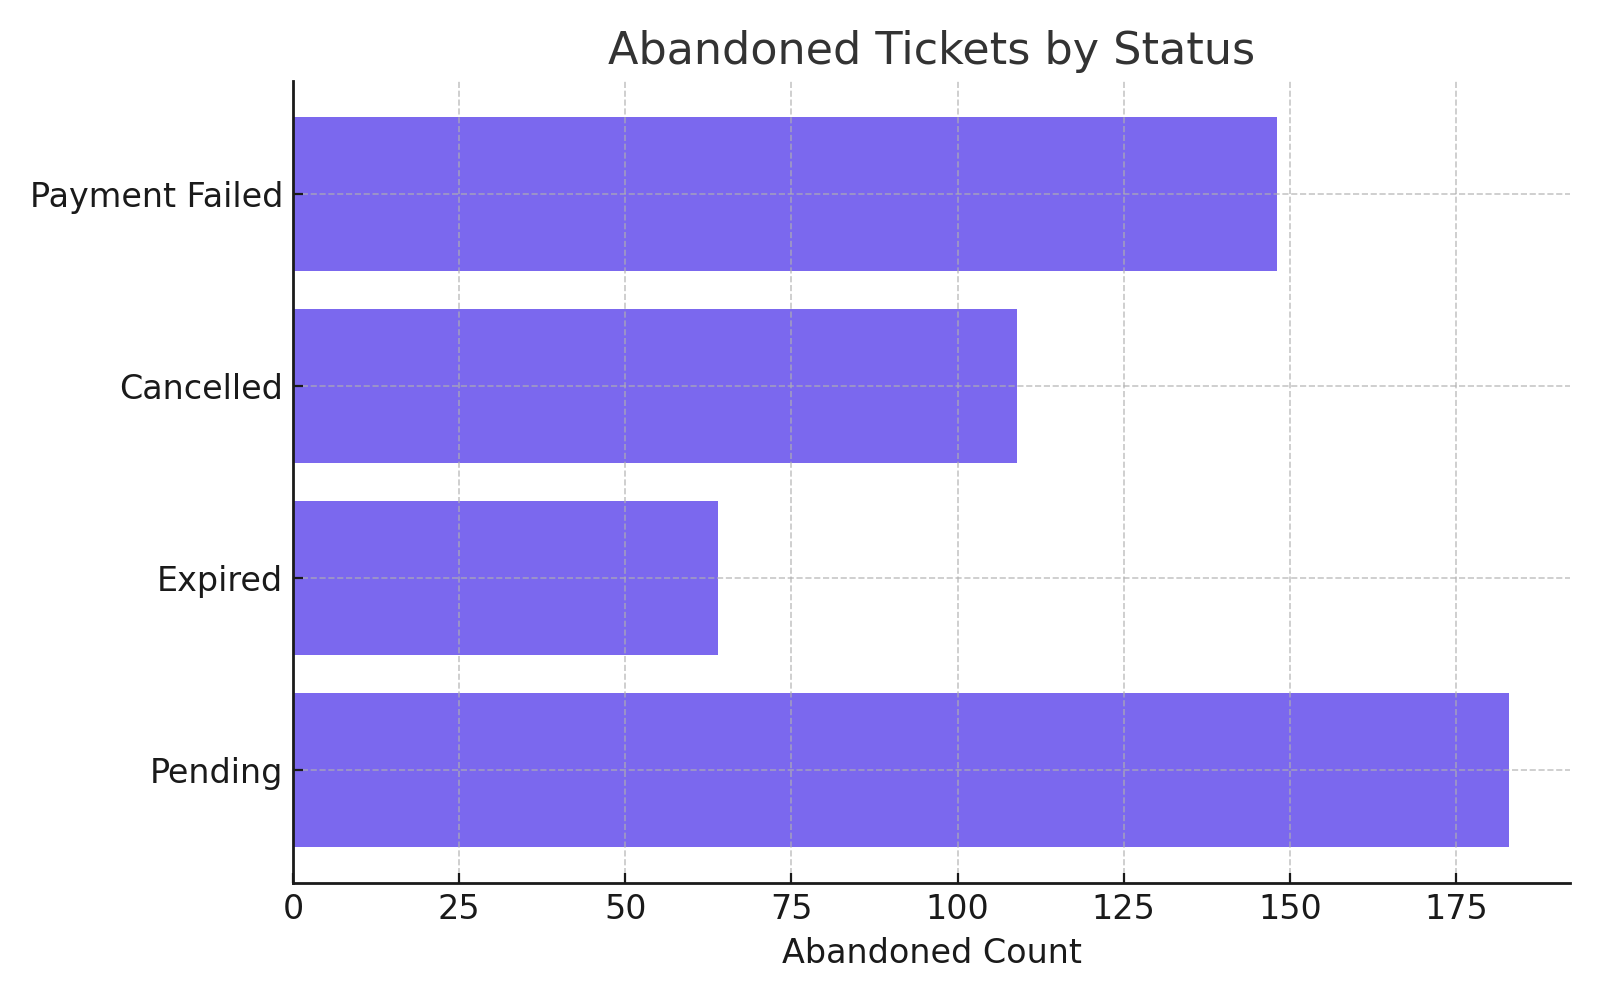
Abandoned Ticket By Status
A breakdown of abandoned tickets by their status (e.g., pending, expired).
How to use it:
- Identify technical or session timeout issues.
- Understand if users left voluntarily vs technical problems.
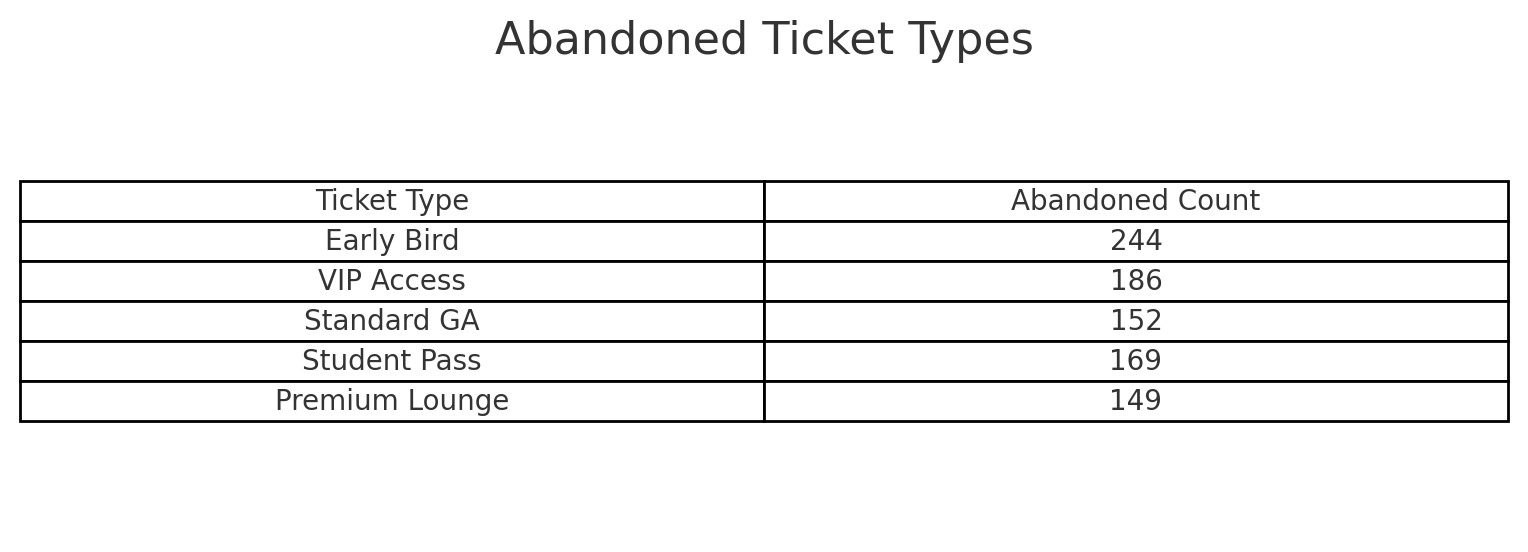
Abandoned Ticket Types
A table listing ticket types (e.g., Early Bird, VIP Access) and how many were abandoned.
How to use it:
- See which products face the highest abandonment rates.
- Adjust pricing, bundling, or inventory based on interest vs purchase hesitation.
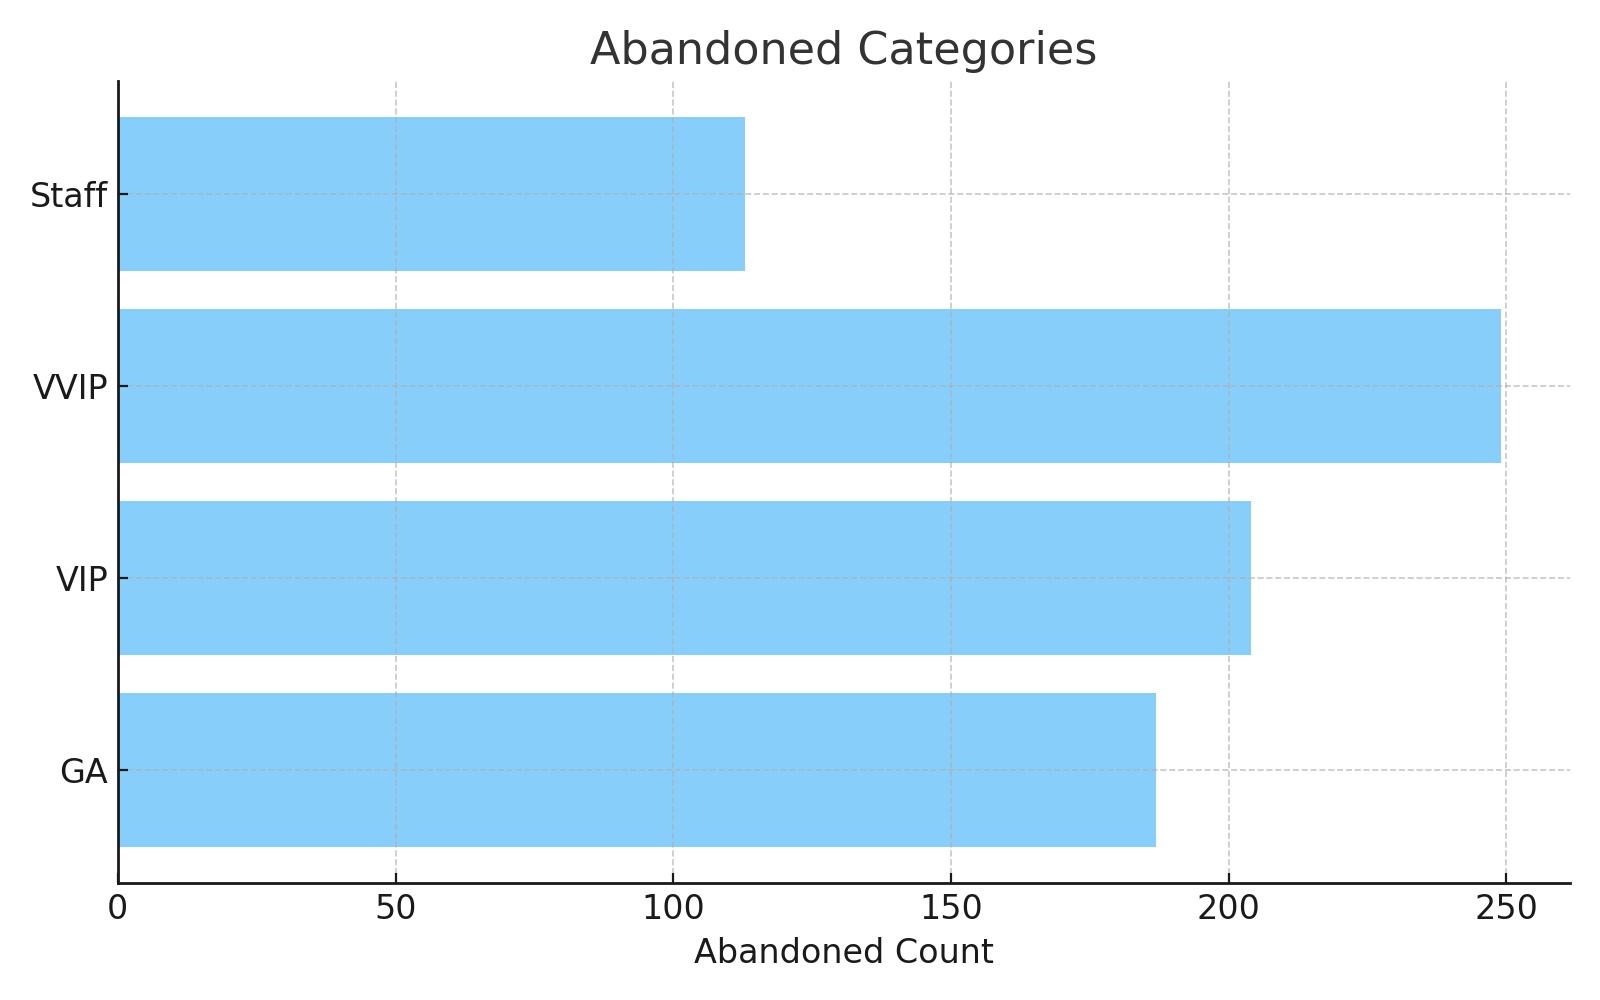
Abandoned Categories
Abandoned tickets grouped by ticket category (e.g., GA, VIP).
How to use it:
- Determine which access levels are more prone to abandonment.
- Guide offers or pricing strategy to improve conversion.
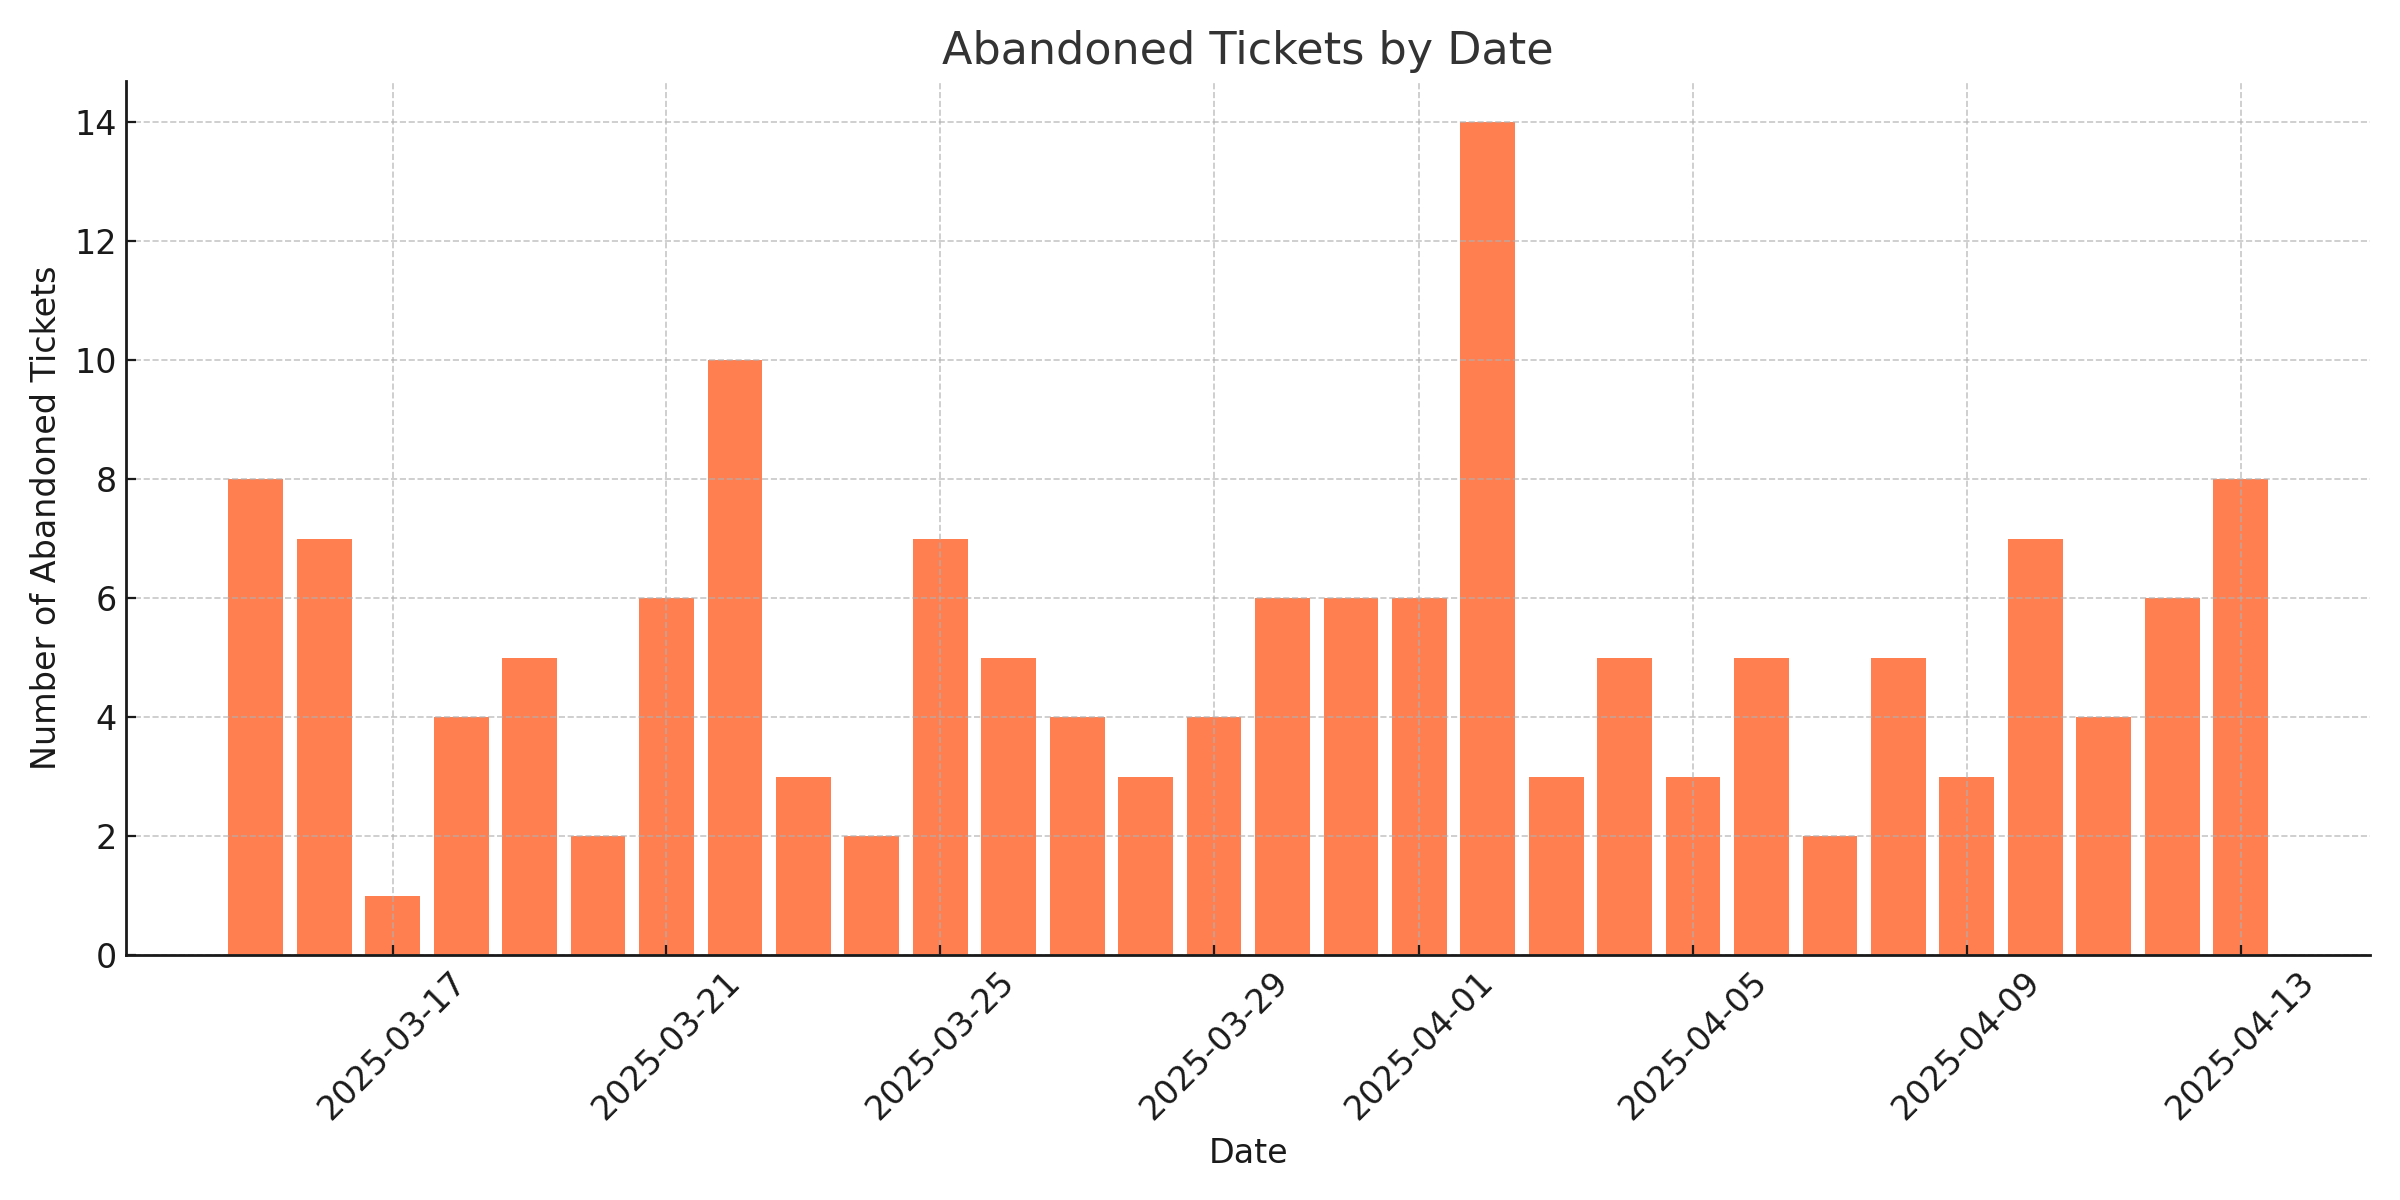
Abandoned Tickets by Date
A time series chart showing how abandoned carts trend across days or weeks.
How to use it:
- Spot spikes related to announcements, price changes, or marketing campaigns.
- Time recovery campaigns based on user behavior patterns.
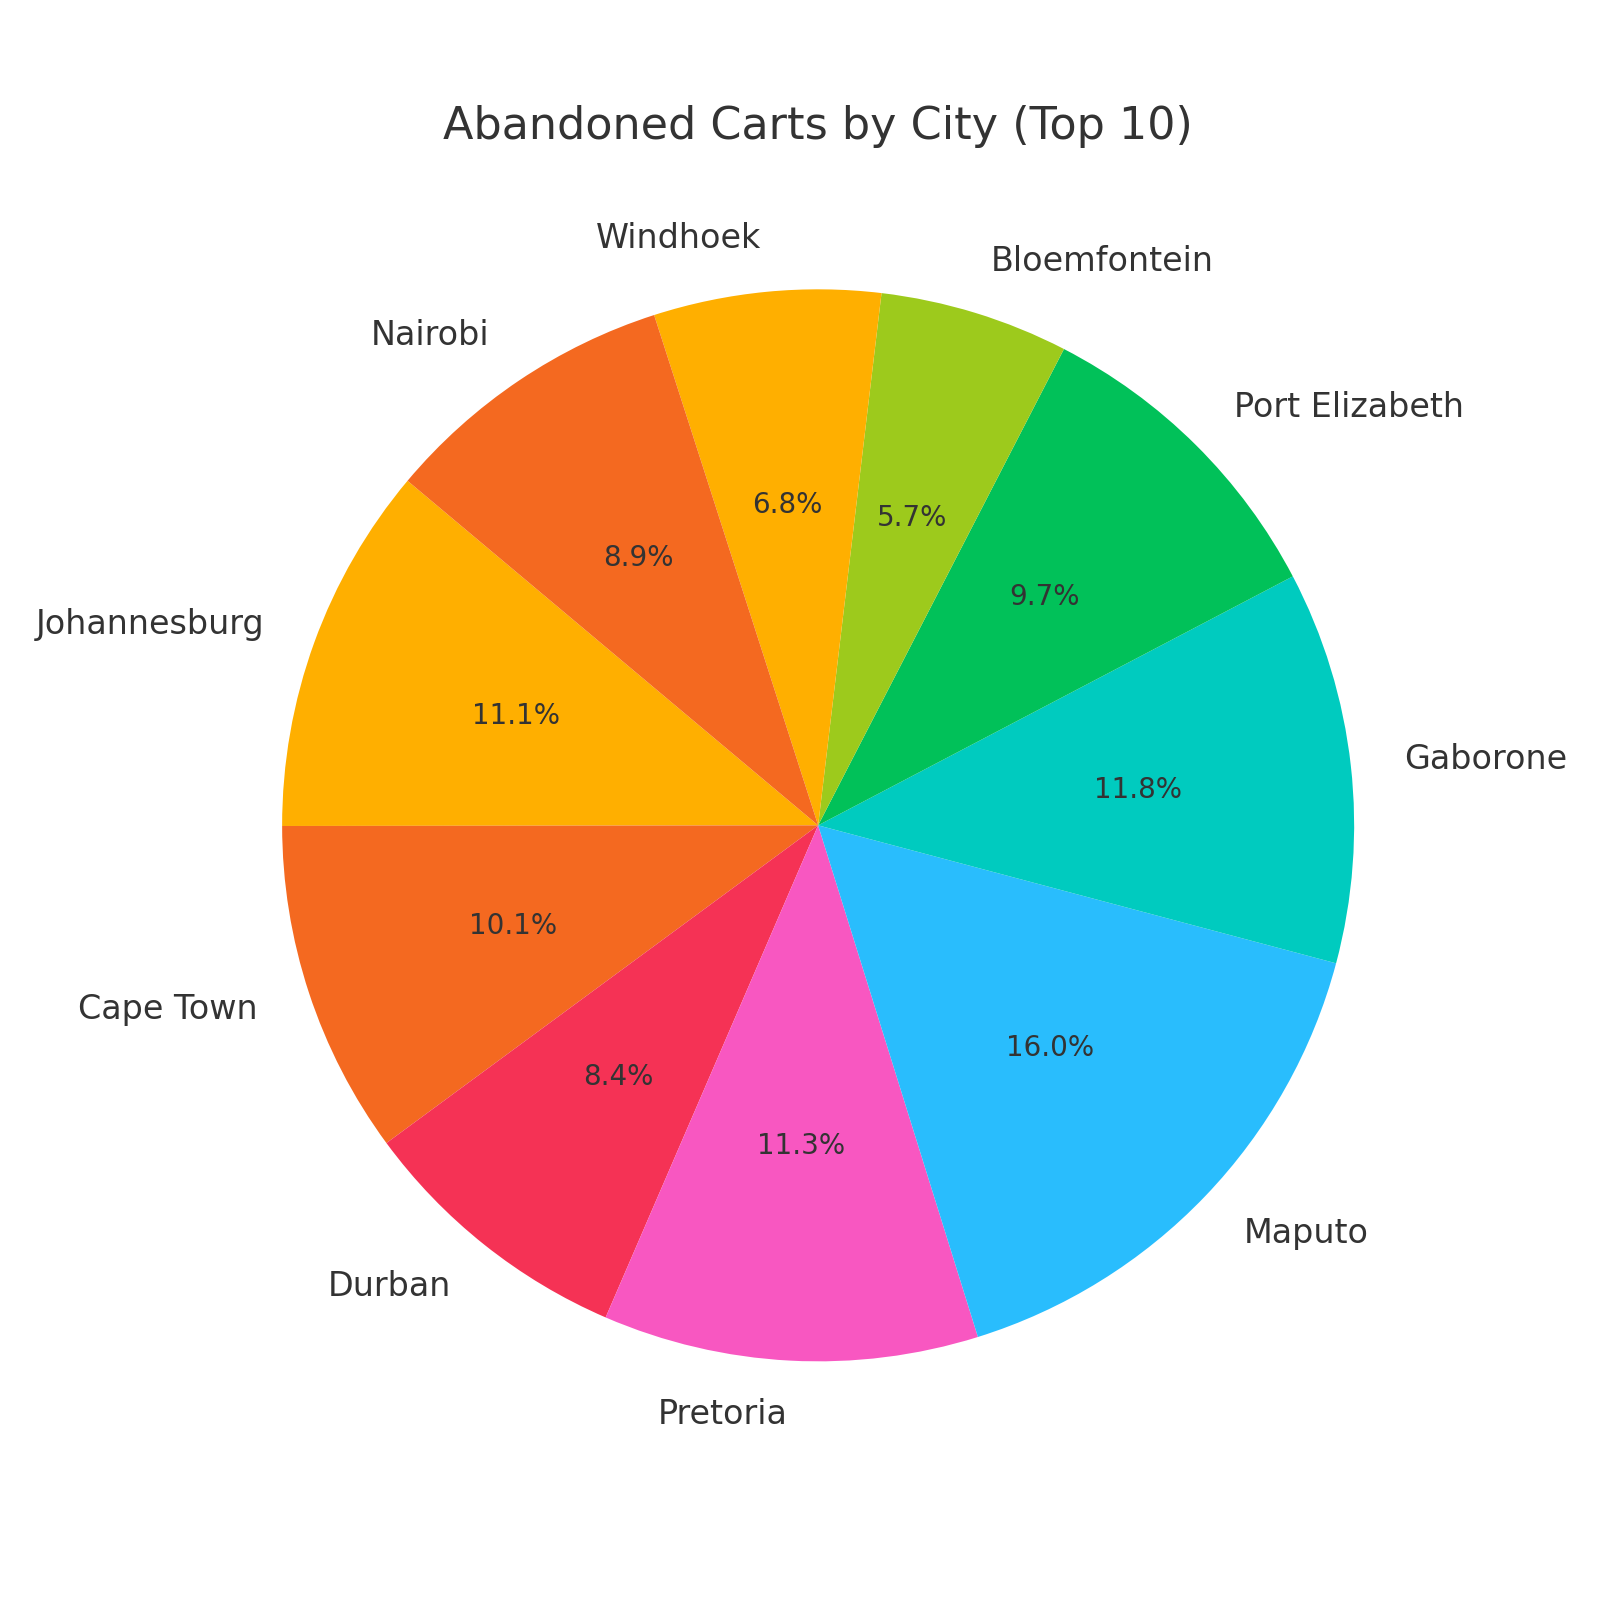
Abandoned Cart by City (Top 20)
Cities generating the most abandoned transactions.
How to use it:
- Localise recovery efforts.
- Diagnose regional preferences, pricing sensitivity, or event relevance.
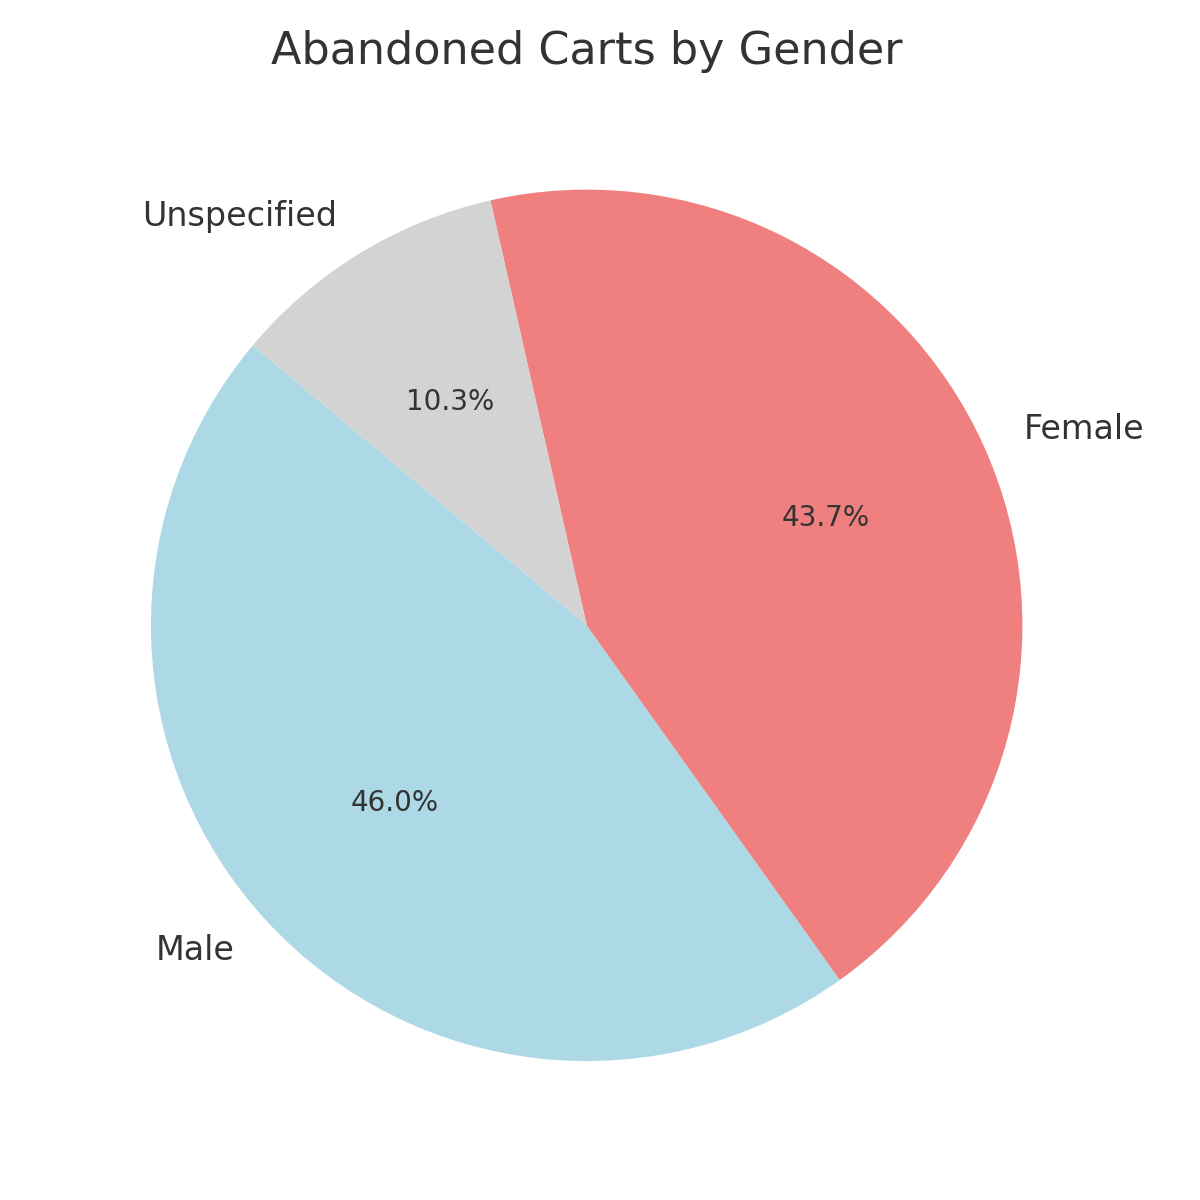
Abandoned Cart by Gender
The gender distribution of users who abandoned tickets.
How to use it:
- Check for demographic skews.
- Tailor messaging based on who is abandoning more often.
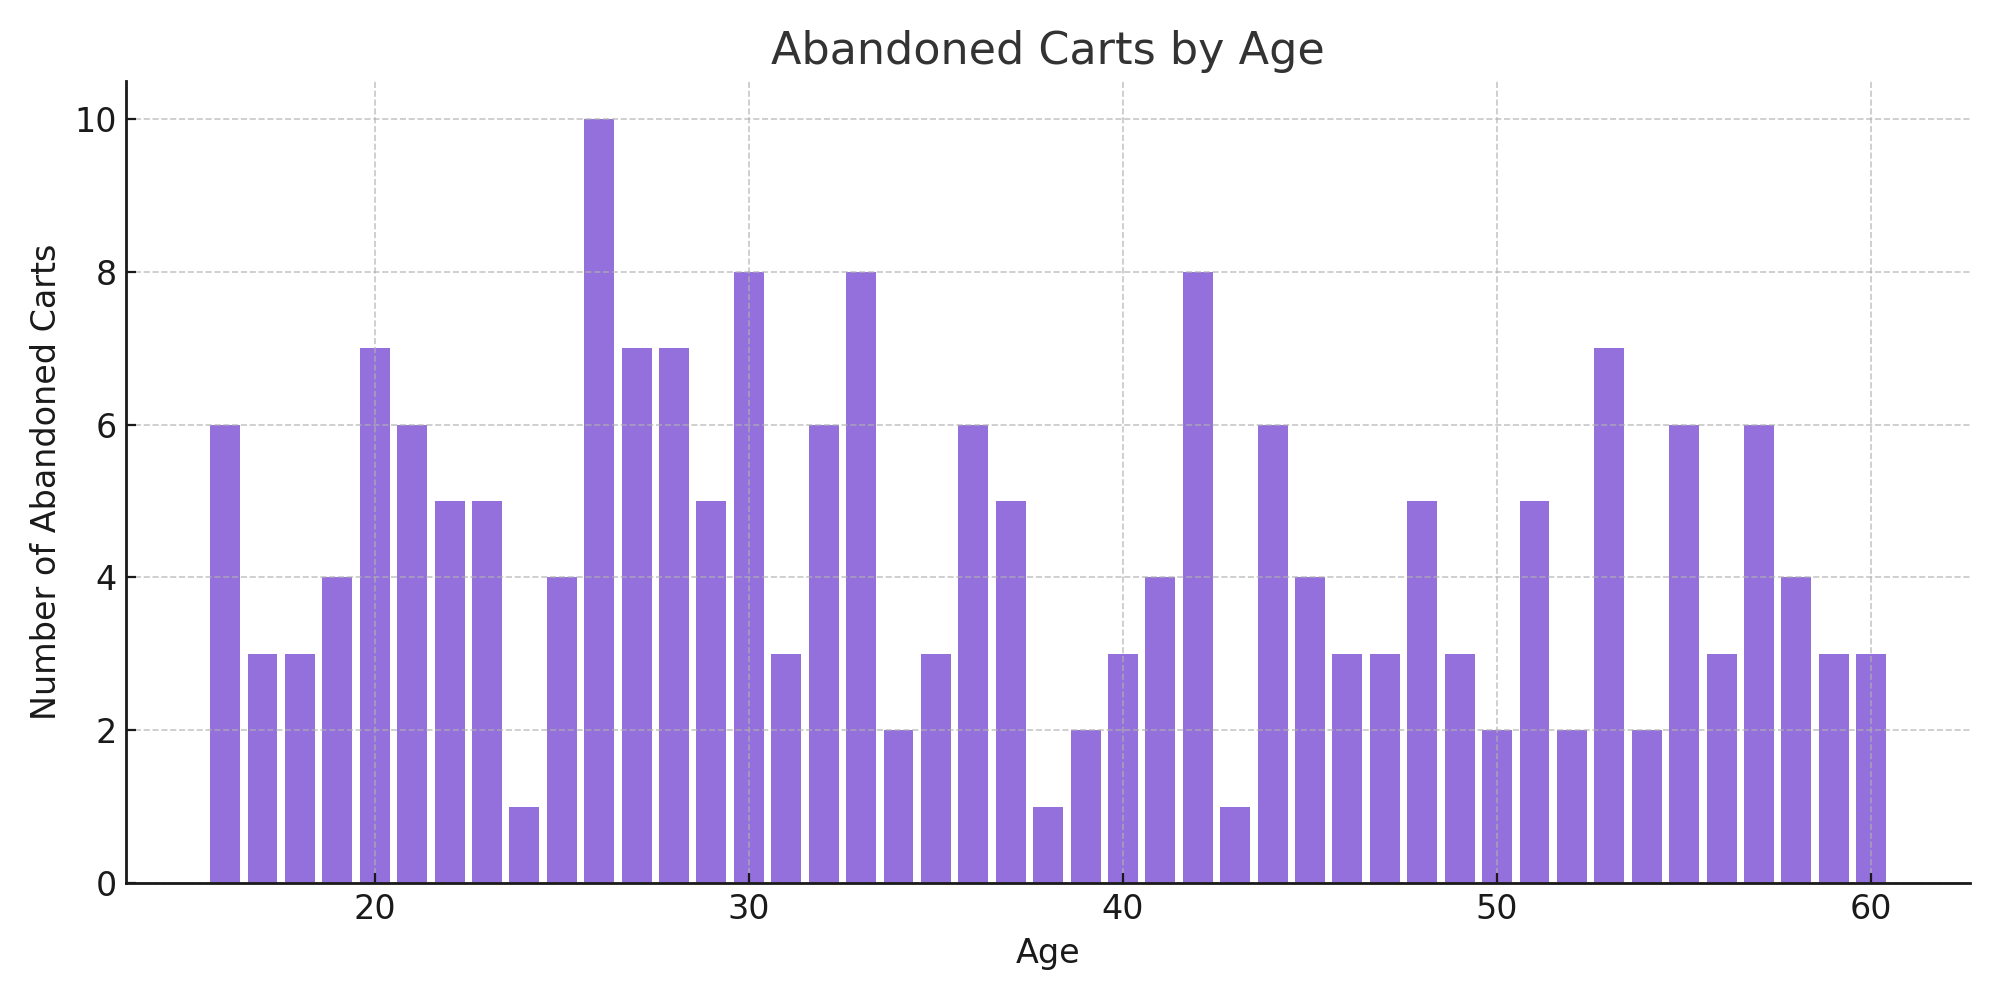
Abandoned Cart by Age
Age groups associated with abandoned transactions.
How to use it:
- Identify whether younger or older users are abandoning more.
- Adjust the checkout UX or communication strategy for different age groups.
Abandoned Cart Details
A table listing user-level detail for each abandoned cart, including:
- Name
- Cellphone
- Ticket type/category
- Abandonment date
How to use it:
- Build direct remarketing lists (email, SMS).
- Investigate abandonment reasons (if combined with survey or CRM data).
- Personalize recovery messages with context.