Attending An Event
Account Settings
Billing and Payment
Account Settings
Delete Your Account
Link Facebook or Google
ID or Passport Number Not Valid
Edit Details on Your Profile
Privacy and Security
Tickets
Cashless
Howler Active
Organising An Event
Getting Started
Video Tutorial - Getting Started
Organiser Approval Process
Getting Started with Howler
Our Services
Getting Paid
Howler Customer Support
Payment Gateway Options - For organisers
Manage your account
Setup your event
How to create an event
How to Make My Event Searchable on Howler.co.za
Event Look and Feel
Ticket Type Settings
How to enable donations for your event
Express Checkin
Enable Ticket Resale for your Event
Marketing Tools
Ticket Reps
How to drive ticket sales
Ticket Bundles and Specials
Issue Complimentary Tickets
Custom Ticket Type Links
Marketing Tools - Sending an email campaign
Marketing Tools - Sending an SMS campaign
Setting Up Google Analytics Tracking
Integrating the Facebook Pixel
Howler Brand/CI/Style Guide
Embedded links
Create a QR code linking to your ticketing page
Sponsor Assigning Complimentary Tickets
Event Customisation
Event Page Customisation within the organiser portal
Premium Event Customisation
How to Optimize an Image
Going Cashless
Going Cashless with Howler
Howler RFID Wristband Design Template
Vendor fees - For organisers
Cashless Sales Reports
How to drive Online Topups for a Cashless event.
Cashless Customer Journey
Ticket Scanning
Reporting
Event Protect
Howler Backend - Active Admin
Howler Backend Active Admin
Howler Backend Active Admin - Manage Organiser Roles
Howler Backend Active Admin - Reps
Howler Backend Active Admin - GTM configuration
Howler Backend Active Admin - Create Ticket Types
Howler Backend Active Admin - Promo Codes
Howler Backend Active Admin - Create a Pre Registration Event
Howler Backend Active Admin - Unique Registration
Howler Backend Active Admin - Data Capture
Streaming Online Events
How to create an Online Streaming Event
How to enable Express Check-in for your event
Finding your stream URL
How to schedule a Facebook Live video stream - Using your computer
How to start a Facebook Live video stream - Using your mobile device
How to setup a private Zoom web conference
Pulse
Dashboard Guide 1.1. Ticketing Overview YoY Analysis
Dashboard Guide 1.2. Daily Sales Dashboard
Dashboard Guide 1.3. Ticket Type YoY Analysis
Dashboard Guide 1.4. Price YoY Analysis
Dashboard Guide 1.5. Payment YoY Analysis
Dashboard Guide 4. Audience YoY Analysis
Dashboard Guide 5. Abandoned Cart
Dashboard Guide 6.1.1. Event Sales Overview
Dashboard Guide 6.1.3. Bar Sales
Dashboard Guide 6.1.5. Event Sales Demographics
Dashboard Guide 6.3.1. Total Topups Overview YoY Analysis
Dashboard Guide 6.3.4. Total Topup Ticket Type YoY Analysis
Dashboard Guide 6.3.5. Total Topup Demographic
Dashboard Guide 6.1.4. Vendor Sales
Dashboard Guide 6.2. Cashless Check-Ins Dashboard
Dashboard Guide 6.1.6 Event Sales Ticket Type Analysis
Dashboard Guide 6.3.3. Onsite Topups YoY Analysis
Dashboard Guide 6.3.2. Online Topups YoY Analysis
Vendor at an event
Setting Up Your Vendor Account
Setting Up For An Event
Setting Up Your Menu
Editing Vendor Bank Details
How to use the Howler Cashless Point of Sales Devices - Training Video
Vendor Fees
Vendor Settlement
The Vendor Agreement
Vendor Sales Reports
Legal
Partners Resources
- All Categories
- Organising An Event
- Pulse
- Dashboard Guide 1.1. Ticketing Overview YoY Analysis
Dashboard Guide 1.1. Ticketing Overview YoY Analysis
 Updated
by Robyn Marais
Updated
by Robyn Marais
This dashboard offers a dynamic and visual overview of year-over-year (YoY) ticketing performance. Built to support informed decision-making, they track essential metrics such as ticket sales, revenue generation, category-level trends, and daily performance insights.
This guide walks you through each key element of the dashboard to explain what the visuals represent and how to interpret the data effectively.
The dashboard enables you to:
- Track real-time ticket sales and revenue growth
- Compare YoY performance across ticket categories and timelines
- Make informed decisions on pricing, inventory allocation, and marketing strategies
- Identify revenue-driving segments and monitor momentum—whether building or slowing
Days to go
At the top of the dashboard, you'll find a “Days to Go” figure to help orient the timeline view.
To ensure a like-for-like comparison between current and past events (even if their dates differ), adjust the “Days Before Event” filter to: is between [inclusive] the current days before value and 360. This aligns data points based on how many days remain before the event date to standardise comparison across events.
Current Event, Change, Past Event
This section presents comparison tiles for four key performance indicators (KPIs):
- Total Tickets Sold
- Gross Revenue
- Orders
- Average Tickets per Order
The visual tiles allow for a quick snapshot of current event performance against the equivalent time frame from the previous year to help you gauge if you’re ahead, behind, or on track.
Ticketing Categories YoY
This tabular view breaks down ticket sales by category (e.g., GA, VIP, VVIP) across the current and past events, including percentage change.
The purpose is to assess how each ticket category is performing compared to the previous year, helping you to optimise pricing and allocation.
Example insight: VIP tickets have seen the largest growth (+7%), highlighting increased demand for premium experiences. This could justify allocating more VIP inventory or enhancing premium offerings.
Ticket Category | Past Event | Current Event | % Change |
GA Tickets | 11,265 | 11,958 | +6% |
VIP Tickets | 1,983 | 2,130 | +7% |
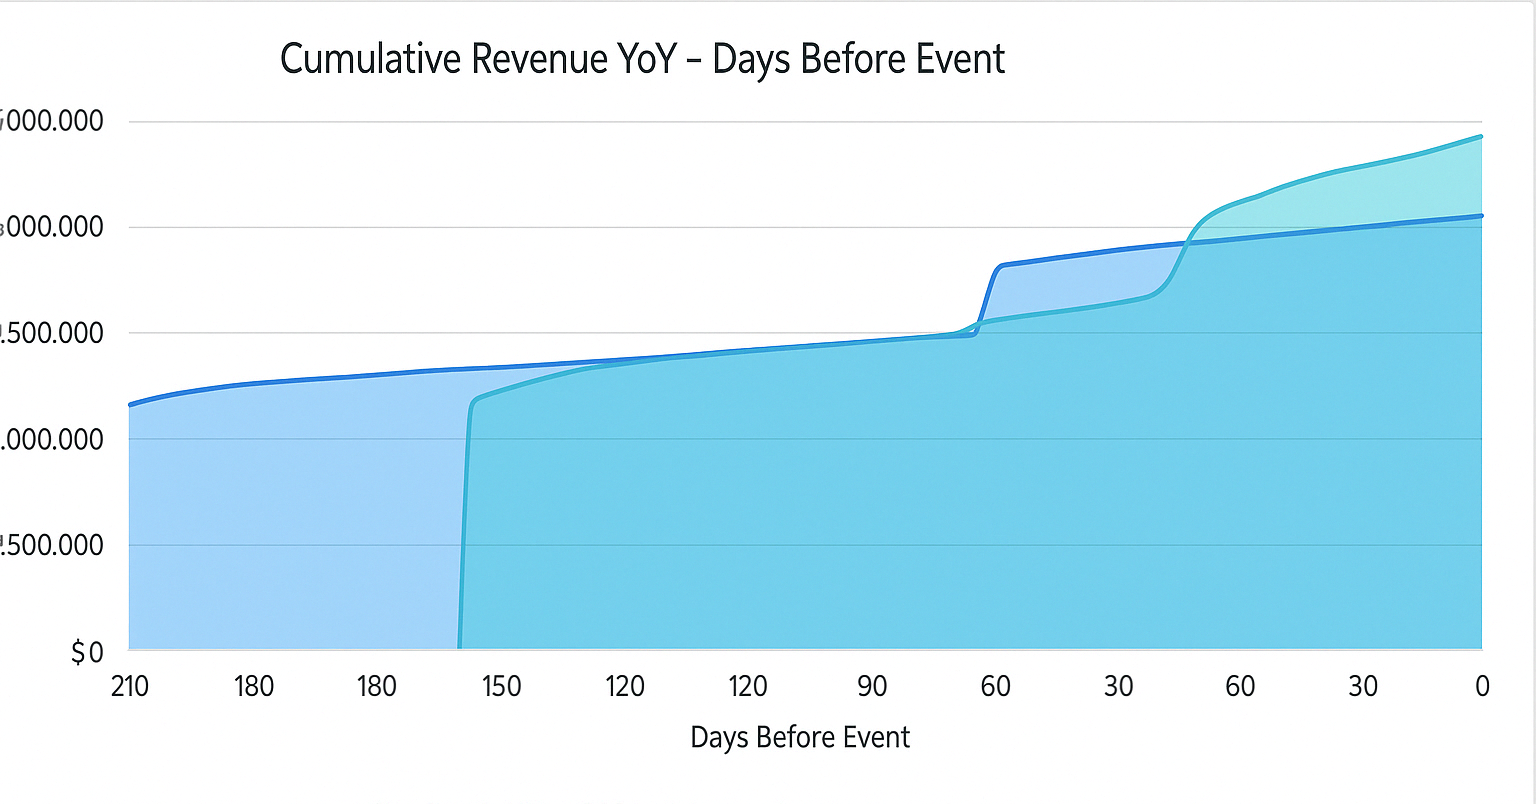
Cumulative Revenue YoY - Days Before Event
This area graph displays gross revenue trends leading up to the event date for both the current and past events.
- Each event is represented by a different color
- Helps visualise sales velocity and forecast future revenue
Example Insight: Revenue for the 2025 event lags behind 2024 until approximately 90 days out but surpasses it between 90 and 60 days before the event, maintaining a strong lead into the final month.
Query Insight
This AI-generated narrative provides instant context based on the visualisations that follow, in this case the Cumulative Ticket Sales YoY data.
- This offers a natural language summary of key trends.
- It eliminates the need for manual interpretation of graphs.
The purpose is to clearly communicate how ticket sales are trending over time relative to the same period last year.
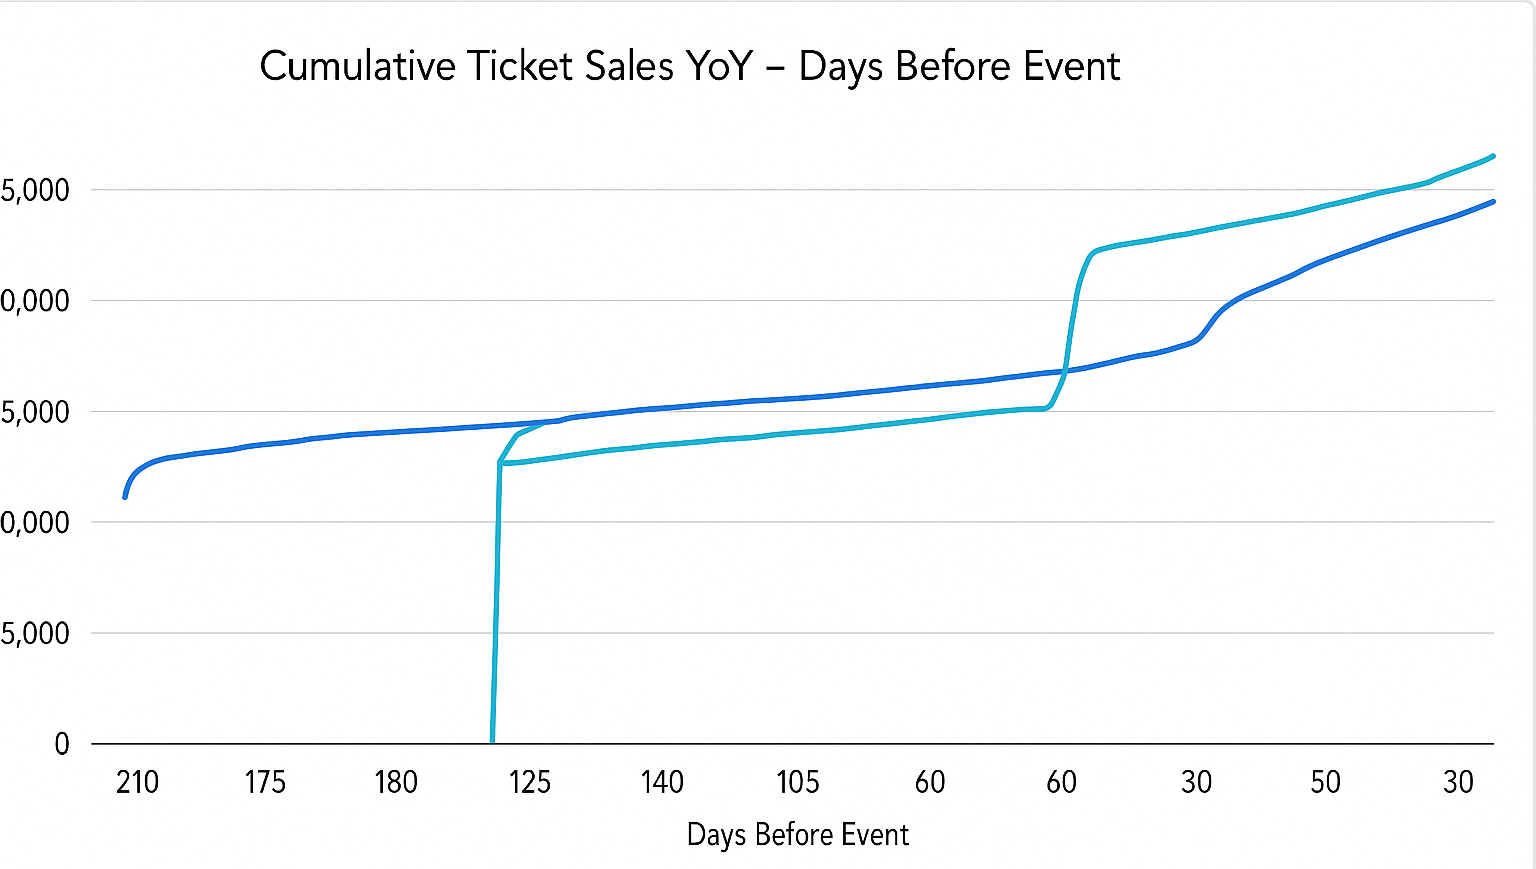
Cumulative Ticket Sales YoY - Days Before Event
A line graph showing cumulative ticket sales for the current event and past event. This tracks the accumulated number of tickets sold over time, helping assess pacing and momentum.
How to Read It:
- The x-axis shows days before the event.
- The y-axis shows cumulative tickets sold.
- Compare lines for past event (blue) and current event (teal).
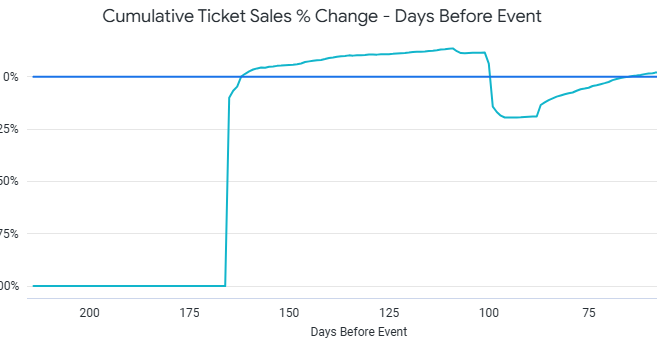
Cumulative Ticket Sales % Change - Days Before Event
A line graph showing cumulative percentage change in ticket sales for the current event and past event. This helps to understand how ticket growth or decline is trending over time.
How to Read It:
- Values above 0% indicate YoY growth.
- Values below 0% indicate underperformance compared to the previous year.
🙋 FAQs
Q: Does this dashboard include complimentary tickets?
A: No – it only tracks paid tickets unless the filter on the dashboard is set to include complimentary tickets.
Q: Are refunds deducted?
A: Refunded tickets are typically excluded from totals, only active tickets are included in sales metrics.
Q: Can I compare more than two events?
A: For best clarity, this dashboard is optimized for comparing two events. Ask your account manager about custom setups for multi-event trends.