Howler Tableau Reports
 Updated
by Robyn Marais
Updated
by Robyn Marais
Howler uses Tableau to provide in-depth event analytics to give you insight into your event. You’ll be able to see all your Cashless and Access Control data updated in real-time (network dependent). This report is your primary source of truth for all data related to your cashless event.
Once your report has been built, you will be sent an invitation to access the reports with unique login details.
You will have access to the reporting suite for 2 months once activated. If you would like to extend this access, an additional fee will be charged. Please contact your Account Manager to request this ahead of the report expiration.
In this report you’ll be able to access insights relating to access control, bar sales, vendor sales and much more.
Terminology
View - This refers to a specific report dashboard. Each different report on Howler Tableau is a different view.
Filter - This refers to changing reports to see only specific data within a report. You can remove irrelevant data by filtering your report to see only what is important.
Export - This refers to the action of downloading your reports.
Washouts - Within the reports, you'll see figures labeled as "washouts". This refers to customers that do not arrive at the event and is calculated as a percentage of tickets sold that were not or have not yet been scanned.
Inflow - Within the reports, you will see figures labeled as "inflow". This refers to all topups including online topups, onsite topups and hospitality topups.
Outflow - Within the reports, you'll see figures labeled as "outfllow". This refers to all cashouts including online cashouts, onsite refunds and customer support refunds.
Filtering
Some reports may allow you to apply filters for a more specific view. Not all reports allow for filtering.
Make sure to clear all filters when you're done.
- Navigate to the view of the report you'd like to filter.
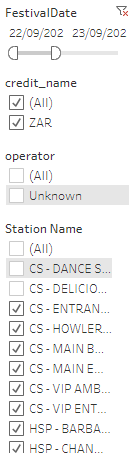
- Use the filtering tool on the right-hand side of the report to deselect and select the information you'd like to see. Scroll to see all fields.
- Toggle the timeline at the top to filter dates.
- The information will take some time to load but will automatically refresh to include the relevant information.
Exporting reports
If you would like to keep a report for longer than your access allows or to send to someone without access to all reports, you can export any view.
- Navigate to the view of the report you'd like to export.
- Select the Download Button on the top right hand side of your view and "Choose a format to Download"

- Select your preferred download format
- Image downloads the information as seen in Howler Tableau as a png.
- Data download all of the raw data which be unhelpful at times. Rather filter in tableau and then export what you need.
- Crosstab downloads this information as an excel document that can be sorted and filtered as needed within excel
- PDF downloads the information as seen in Howler Tableau as a PDF document.
- Powerpoint downloads the information as seen in Howler Tableau as a Powerpoint presentation.
- Your download will start in your browser downloads.
Troubleshooting
My data isn't loading or is taking long to load
Howler Tableau access all of the data points across your event. This is a lot of data. This can be a challenge for some devices and networks. For your device to process and display this data, you'll need enough processing power as well as a very stable network connection.
If you're having trouble, try reloading the page view or try a different device or stronger network.
My data is not updating in real-time
For your reports to be updated in real-time during your event, all Howler devices must have stable connectivity. If the data is not updating but sales are being made on site, there may be a delay with devices uploading the information. If the onsite network is unstable, these reports may not be updating in real-time.
As we cannot guarantee that all devices are uploading data due to network, all reports during an event are to be considered as provisional. Your reports are not considered final until all event data has been consolidated. (Up to 3 business days after the conclusion of your event)
Report Views
When you are given access to Howler Tableau, you'll see a number of different views available. You'll be able to see all views within your event workbook. These different views are used to extract different insights. Y
Summary reports
Snapshot Report
This acts as a holistic summary of the event that highlights checkins, top-ups and top sales.
This view provides a complete overview of the event. It details the number of check-ins and washouts across ticket categories. It highlights the average spend value per customer as well as the percentage of customers who are not spending. It also includes the top five performing bars and the top five performing products.
Cashless Summary
This acts as a holistic summary of your cashless event data that highlights topups, sales, cashouts and remaining leftover funds.
This view provides a complete overview of the cashless data of your event. It details the origins of topups (online, onsite, admin or customer support (CS)) as well as sales split by bar sales, vendor sales and tips.
Pre-event reports
Online topups
This view displays an overview of online topups. The quantity, value and average topup value are available at the top of this report.
A timeline of the quantity and value of the online topups are displayed as graphs.
During event reports
Check-in and Capacity
Check-in per ticket type (table)
This displays the number of tickets checked in compared to the number of tickets sold.
This report allows you to see how many tickets have been checked in per ticket type. It also allows you to compare the number of tickets checked-in against the total number of tickets sold and provides you with the wash out numbers.
Check-Ins per 10 / 30 / 60 minutes (Table)
This displays the number of tickets checked in per station which provides an indication of how busy each gate is and the number of people going through each check-in station.
This report allows you to see a heat map of how many tickets are being checked-in at the different check-in stations. It also provides a running total of number of check-ins per the different time intervals. This can be filtered by device to provide a more detailed view of how many tickets each device is checking in.
Onsite Topups (Only available for European events)
Onsite Top-Ups
This displays the total number and value of onsite topups and the payment methods used.
This report shows you the total number and value of on-site topups and provides a breakdown of which payment methods customers are using to make top-ups. It also shows you the value of top-ups per each hour of the event.
Onsite Topups per Station
This displays the total topup value that each topup station is processing per hour, this allows you to see the busy topup stations.
This report shows you the value of topups for each top station, every hour. It shows the hours and stations where the most topups were done on-site. This report can be filtered by payment method to provide an understanding of how people are choosing to top up, ie. using cash or card.
Post event reports
Bar Sales
Event sales summary
This view displays the total bar and vendor sales quantity and value as well as the average cost of an item. A timeline of sales split between vendors and bars is displayed as a graph.
This gives you a good overview of what sales have been made, what customers spend at your event and where they spend their money at your event.
Bar Sales Summary
This displays the total bar sales at the event in terms of value and quantity of goods sold.
The summary provides an overview of the value of bar sales per hour at the event, as well as the total bar sale value at each bar. This report is handy for a quick overview of sales value.
Total Bars per Hour (Qty / Amount)
This displays the total sales (by quantity or value) of each product per bar per hour, a breakdown of how well each bar product is performing and which bar is the busiest.
This report provides a view of the total quantity sold of each product or the total sales value of each product across the different bars per hour. This report can be filtered by operator, credit type, hour, product or station name to allow for a more granular view or to allow for easy comparisons.
Total Bars per Day (Qty / Amount)
This is a quick view of the total quantity sold or the total sales value of each product sold at the different bars.
This report is a total view that can be used during the event for a quick summary that is less granular and operational than the above report. At the end of an event it shows a summary of the products that were sold and at which bars. This can also be filtered by operator, credit type, hour, product or station name to allow for easy comparisons.
Average spend per customer
This view breaks down the average spend per customer across a timeline of the event as well as the most popular stations and products.
This also breaks down the average spend of a customer on a specific customer.