Attending An Event
Account Settings
Billing and Payment
Account Settings
Delete Your Account
Link Facebook or Google
ID or Passport Number Not Valid
Edit Details on Your Profile
Privacy and Security
Tickets
Cashless
Howler Active
Organising An Event
Getting Started
Video Tutorial - Getting Started
Organiser Approval Process
Getting Started with Howler
Our Services
Getting Paid
Howler Customer Support
Payment Gateway Options - For organisers
Manage your account
Setup your event
How to create an event
How to Make My Event Searchable on Howler.co.za
Event Look and Feel
Ticket Type Settings
How to enable donations for your event
Express Checkin
Enable Ticket Resale for your Event
Marketing Tools
Ticket Reps
How to drive ticket sales
Ticket Bundles and Specials
Issue Complimentary Tickets
Custom Ticket Type Links
Marketing Tools - Sending an email campaign
Marketing Tools - Sending an SMS campaign
Setting Up Google Analytics Tracking
Integrating the Facebook Pixel
Howler Brand/CI/Style Guide
Embedded links
Create a QR code linking to your ticketing page
Sponsor Assigning Complimentary Tickets
Event Customisation
Event Page Customisation within the organiser portal
Premium Event Customisation
How to Optimize an Image
Going Cashless
Going Cashless with Howler
Howler RFID Wristband Design Template
Vendor fees - For organisers
Cashless Sales Reports
How to drive Online Topups for a Cashless event.
Cashless Customer Journey
Ticket Scanning
Reporting
Event Protect
Howler Backend - Active Admin
Howler Backend Active Admin
Howler Backend Active Admin - Manage Organiser Roles
Howler Backend Active Admin - Reps
Howler Backend Active Admin - GTM configuration
Howler Backend Active Admin - Create Ticket Types
Howler Backend Active Admin - Promo Codes
Howler Backend Active Admin - Create a Pre Registration Event
Howler Backend Active Admin - Unique Registration
Howler Backend Active Admin - Data Capture
Streaming Online Events
How to create an Online Streaming Event
How to enable Express Check-in for your event
Finding your stream URL
How to schedule a Facebook Live video stream - Using your computer
How to start a Facebook Live video stream - Using your mobile device
How to setup a private Zoom web conference
Pulse
Dashboard Guide 1.1. Ticketing Overview YoY Analysis
Dashboard Guide 1.2. Daily Sales Dashboard
Dashboard Guide 1.3. Ticket Type YoY Analysis
Dashboard Guide 1.4. Price YoY Analysis
Dashboard Guide 1.5. Payment YoY Analysis
Dashboard Guide 4. Audience YoY Analysis
Dashboard Guide 5. Abandoned Cart
Dashboard Guide 6.1.1. Event Sales Overview
Dashboard Guide 6.1.3. Bar Sales
Dashboard Guide 6.1.5. Event Sales Demographics
Dashboard Guide 6.3.1. Total Topups Overview YoY Analysis
Dashboard Guide 6.3.4. Total Topup Ticket Type YoY Analysis
Dashboard Guide 6.3.5. Total Topup Demographic
Dashboard Guide 6.1.4. Vendor Sales
Dashboard Guide 6.2. Cashless Check-Ins Dashboard
Dashboard Guide 6.1.6 Event Sales Ticket Type Analysis
Dashboard Guide 6.3.3. Onsite Topups YoY Analysis
Dashboard Guide 6.3.2. Online Topups YoY Analysis
Vendor at an event
Setting Up Your Vendor Account
Setting Up For An Event
Setting Up Your Menu
Editing Vendor Bank Details
How to use the Howler Cashless Point of Sales Devices - Training Video
Vendor Fees
Vendor Settlement
The Vendor Agreement
Vendor Sales Reports
Legal
Partners Resources
- All Categories
- Organising An Event
- Pulse
- Dashboard Guide 6.3.2. Online Topups YoY Analysis
Dashboard Guide 6.3.2. Online Topups YoY Analysis
 Updated
by Robyn Marais
Updated
by Robyn Marais
This dashboard provides a year-over-year (YoY) analysis of online topup behavior, offering insight into when, how, and by whom topups are made leading up to an event. It supports planning around guest communication, infrastructure needs, pricing strategy, and digital engagement campaigns.
This guide walks you through each key element of the dashboard to explain what the visuals represent and how to interpret the data effectively.
The dashboard enables you to:
Track total online topup value, volume, and average transaction size.
Understand timing patterns for topups to optimize comms and incentives.
Identify which ticket categories and types are driving the highest pre-event engagement.
Correlate ticket purchase timing with topup behavior.
Inform VIP segmentation and high-value guest targeting.
Key Metrics
Total Online Topups: The total ZAR value of all online topup transactions.
Online Topups (Qty): The number of individual online topup transactions.
Average Online Topups: Total Online Topups, divided by number of Online Topup transactions.
Average Online Topup Per Person: Total Online Topups divided by number of customers who topped up.
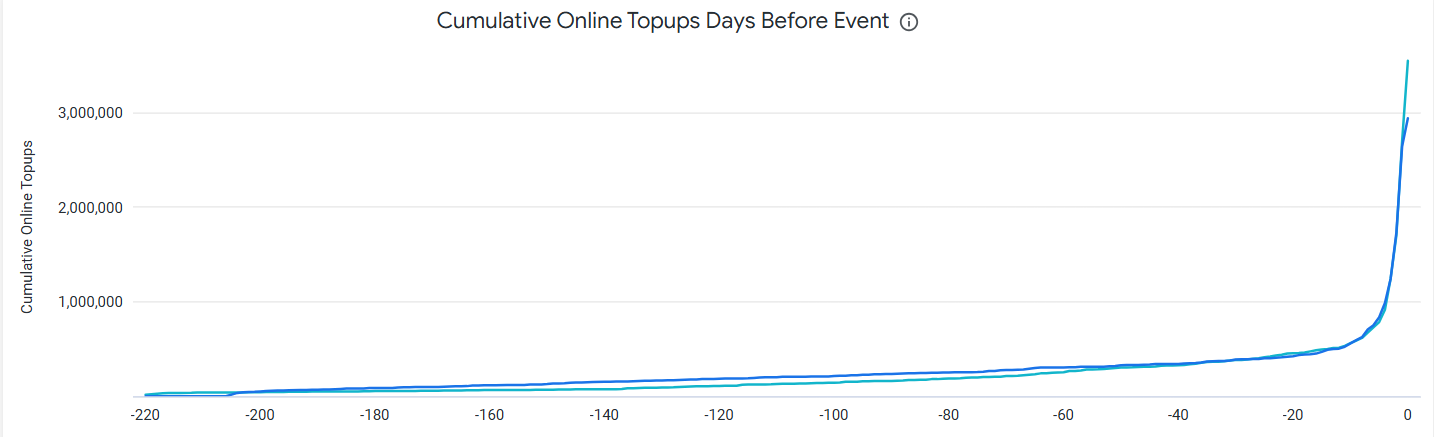
Cumulative Online Topups Days Before Event
This line chart visualizes how online topup revenue accumulates as the event approaches.
- How to use it: Spot growth patterns, identify surges in topup behavior, and assess the effectiveness of digital campaigns.
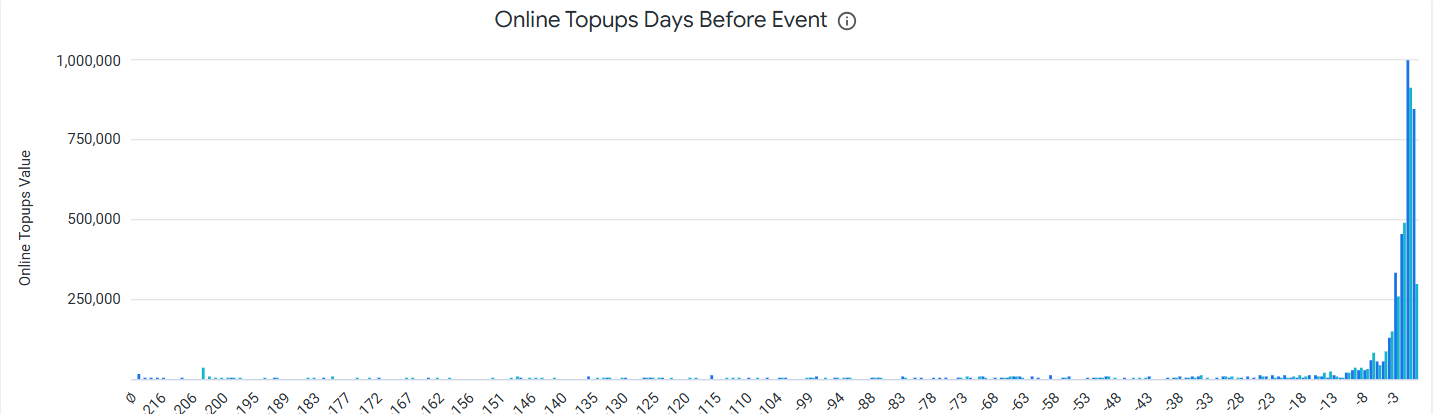
Online Topups Days Before Event
A bar chart showing daily topup totals in the lead-up to the event.
- How to use it: Identify precise peaks in behavior (e.g., email campaign days).
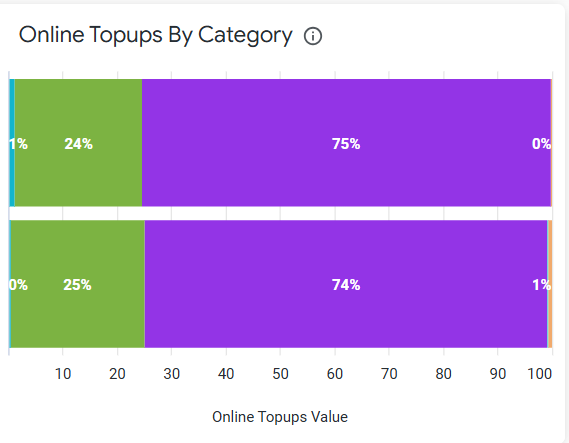
Online Topups By Category
A horizontal bar graph representing topup value distribution across ticket categories for the current event and past event.
- How to use it: Understand where the value lies—e.g., Golden Lounge vs. Main Arena.
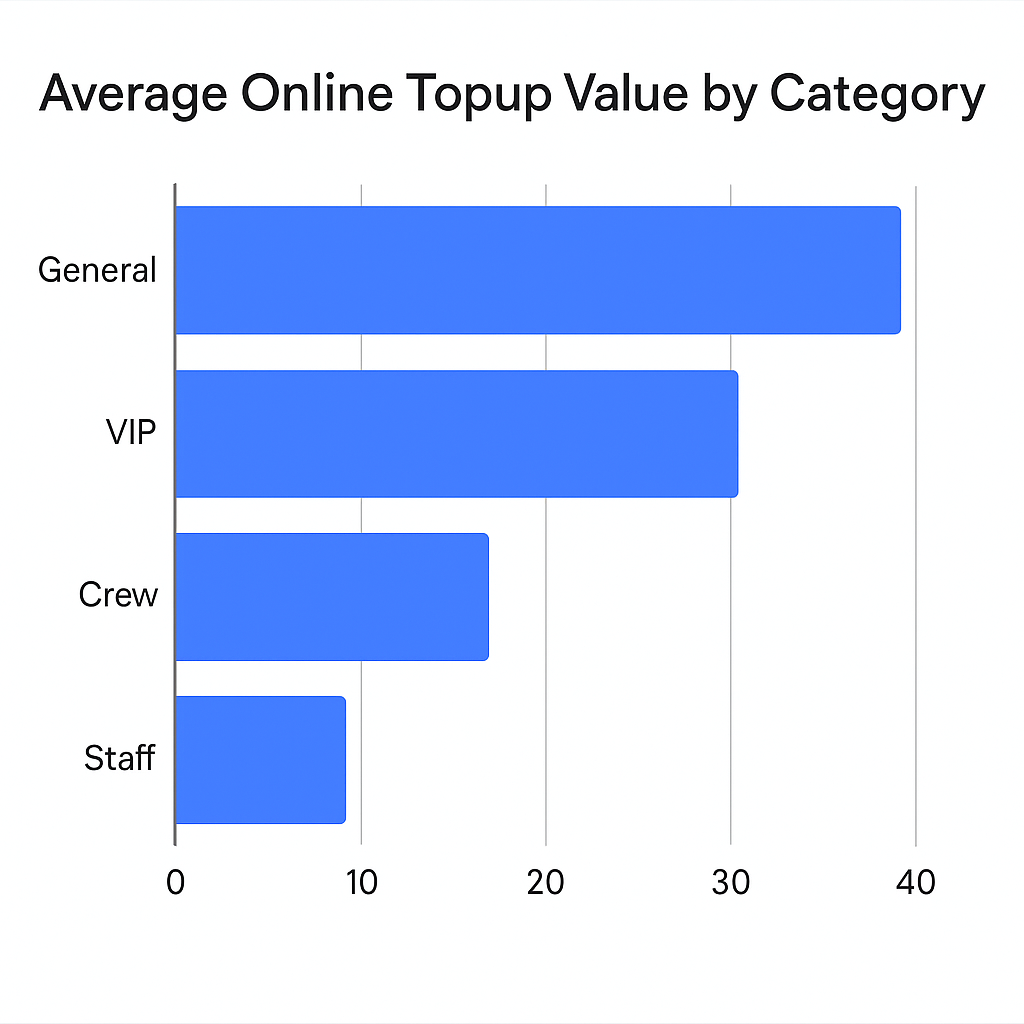
Average Online Topup Value by Category
A horizontal bar graph comparing average online topup values by ticket category.
- How to use it: Reveal premium segments with higher engagement.
Query Insights
This AI-generated narrative provides instant context based on the visualisations that follow, in this case the Total Toups Contribution By Ticket Purchase Date data.
- This offers a natural language summary of key trends.
- It eliminates the need for manual interpretation of graphs.
The purpose is to clearly communicate how topup values are trending over time relative to the same period last year.
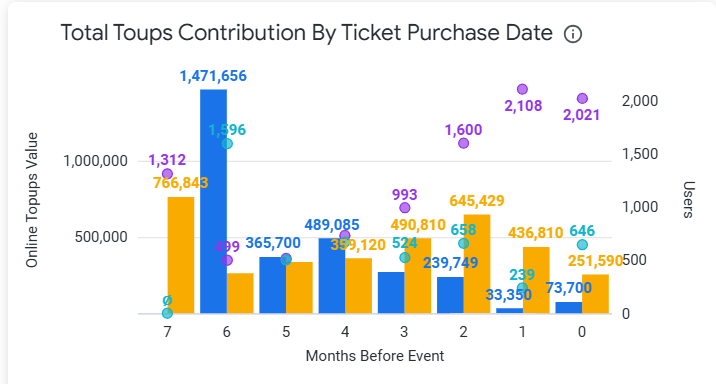
Total Toups Contribution By Ticket Purchase Date
A combo bar + dot chart showing topup values and core ticket volumes by when guests purchased tickets (months before event).
- How to use it: Analyze how early vs. late buyers behave financially.
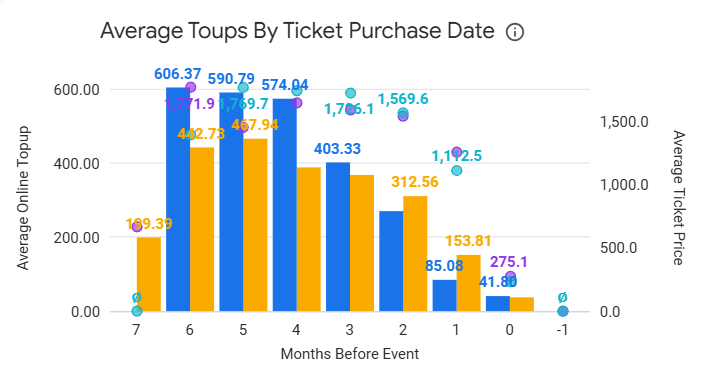
Average Toups By Ticket Purchase Date
A dual-axis chart plotting both:
- Bar: Average online topup
- Dot: Average ticket price
for different purchase windows. - How to use it: Identify if early buyers top up more or less, to refine timing strategies.
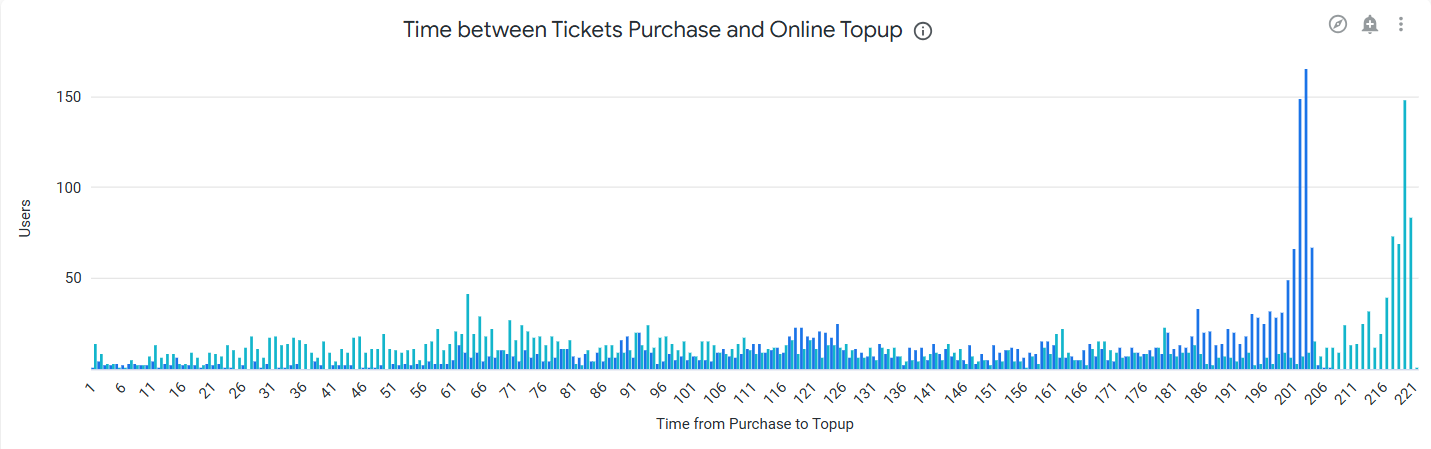
Time between Tickets Purchase and Online Topup
This visual (timeline/histogram) shows how many days after buying a ticket a user typically tops up.
- How to use it: Inform follow-up campaign timing.
Query Insights
This AI-generated narrative provides instant context based on the visualisations that follow, in this case the Customer Value By Ticket Category data.
- This offers a natural language summary of key trends.
- It eliminates the need for manual interpretation of graphs.
The purpose is to clearly communicate how customer value relates to ticket category relative to the same period last year.
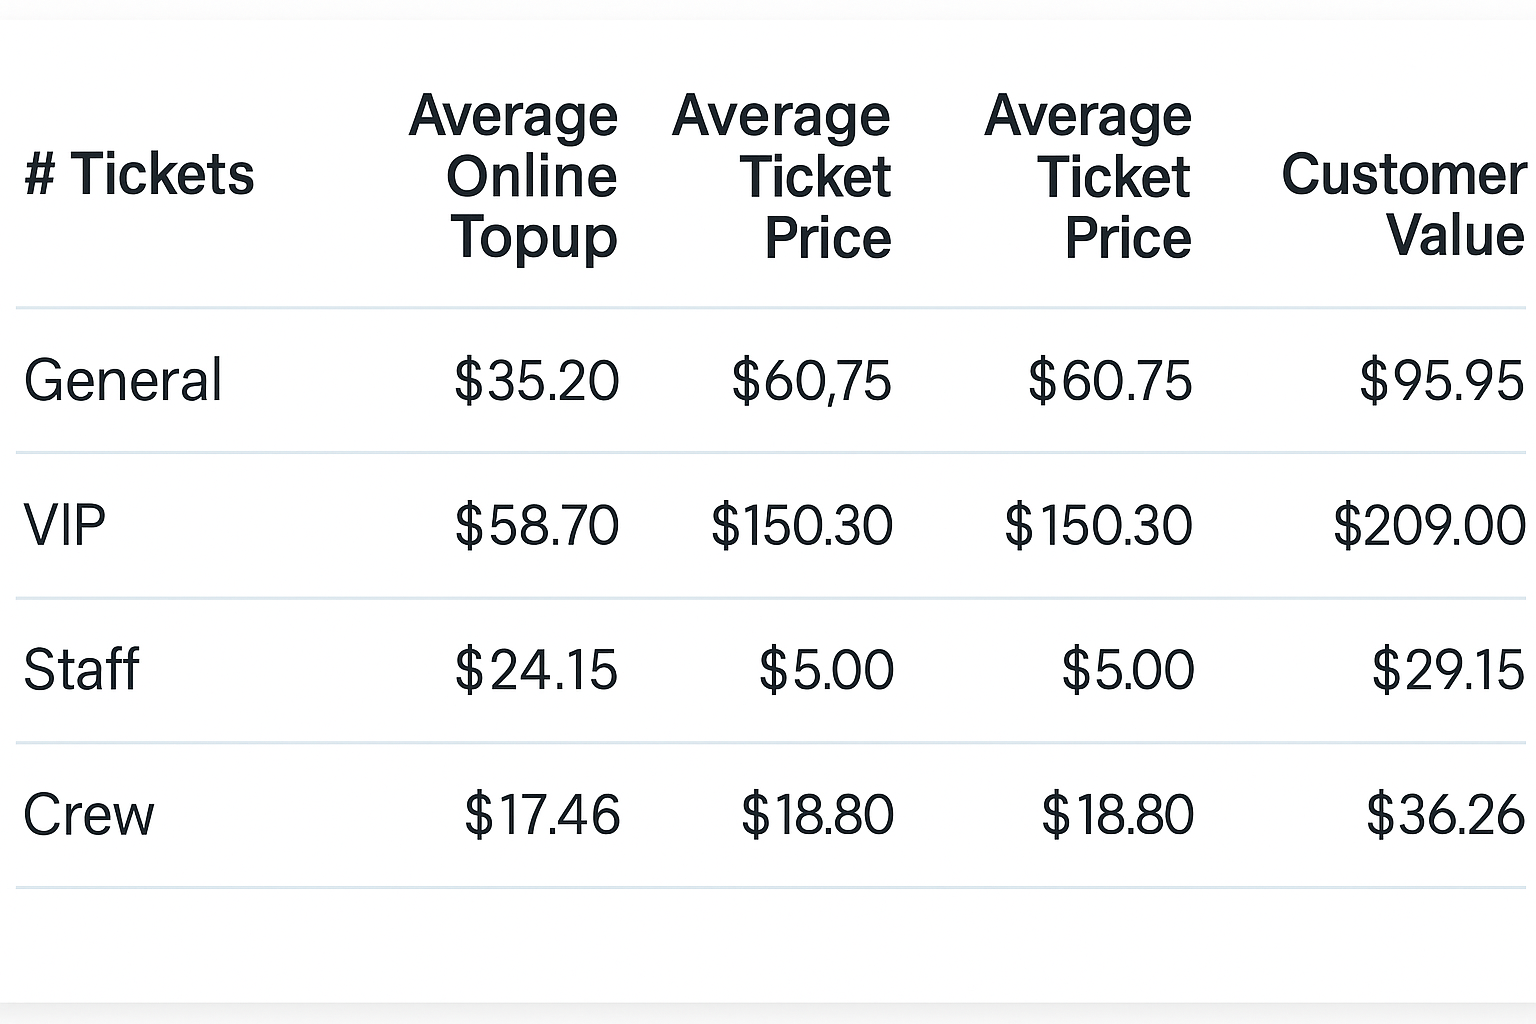
Customer Value By Ticket Category (Online Topups + Ticketing)
A summary table showing:
- Ticket count
- Average online topup
- Average ticket price
- Combined customer value
How to use it:
- Spot high-value audience segments.
- Justify pricing or incentive adjustments.
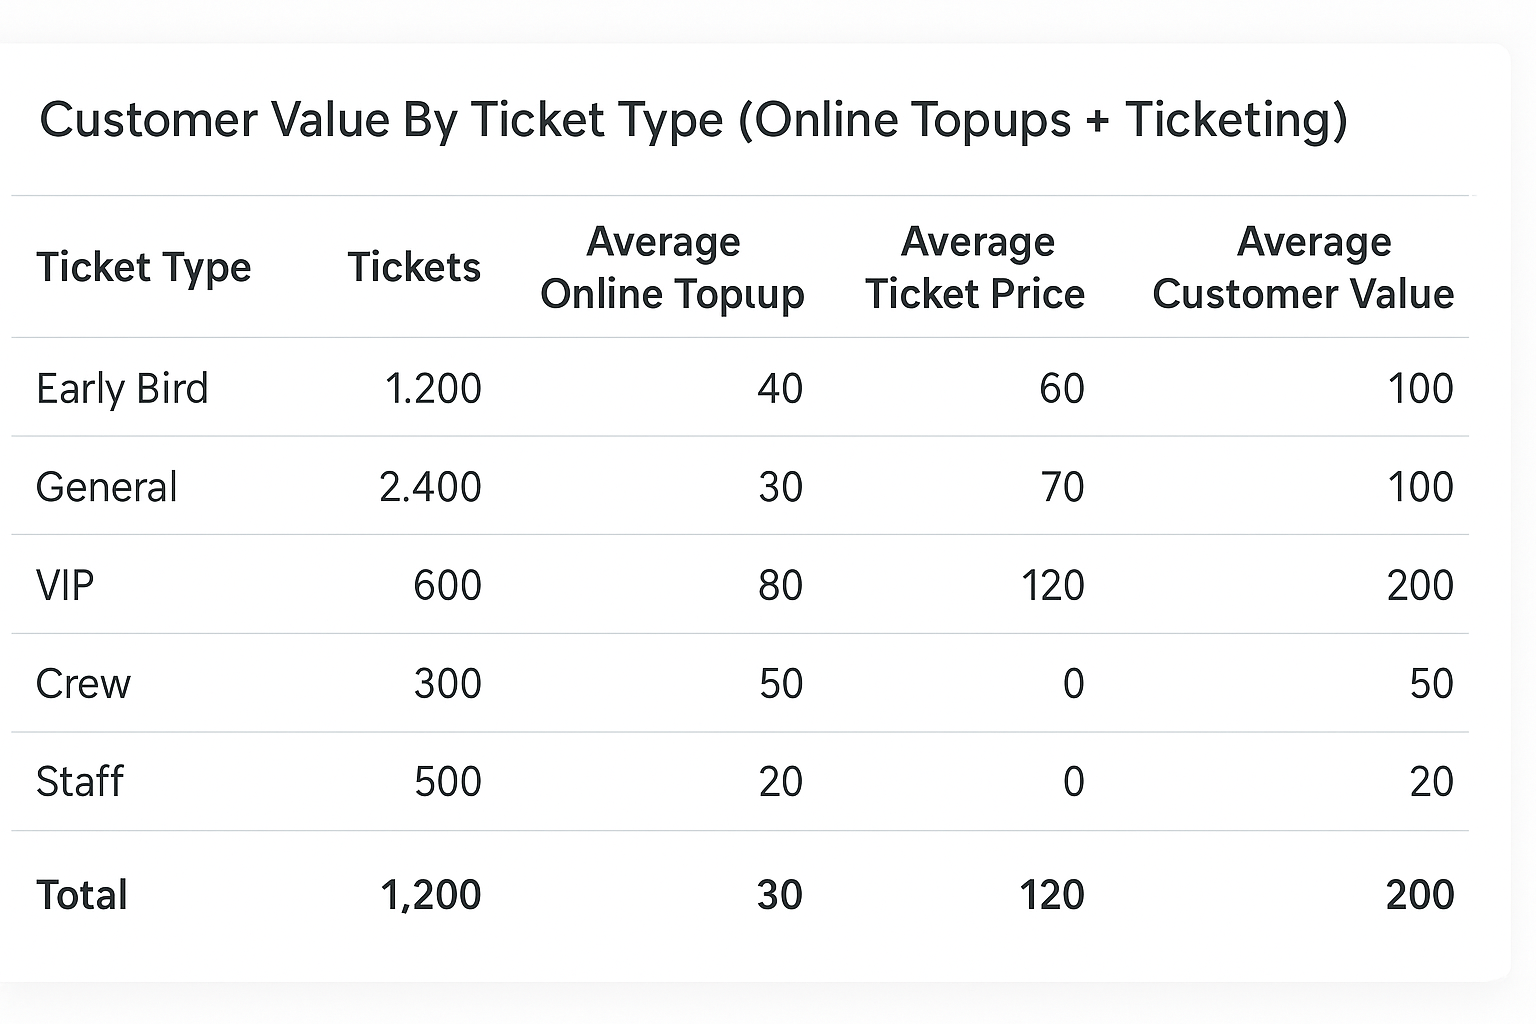
Customer Value By Ticket Type (Online Topups + Ticketing)
A detailed table breakdown by ticket type (e.g., Early Bird + Credits) showing:
- Average online topup
- Ticket price
- Combined value
How to use it:
- Analyze performance at a micro level.
- Understand which ticket products attract top spenders.