Attending An Event
Account Settings
Billing and Payment
Account Settings
Delete Your Account
Link Facebook or Google
ID or Passport Number Not Valid
Edit Details on Your Profile
Privacy and Security
Tickets
Cashless
Howler Active
Organising An Event
Getting Started
Video Tutorial - Getting Started
Organiser Approval Process
Getting Started with Howler
Our Services
Getting Paid
Howler Customer Support
Payment Gateway Options - For organisers
Manage your account
Setup your event
How to create an event
How to Make My Event Searchable on Howler.co.za
Event Look and Feel
Ticket Type Settings
How to enable donations for your event
Express Checkin
Enable Ticket Resale for your Event
Marketing Tools
Ticket Reps
How to drive ticket sales
Ticket Bundles and Specials
Issue Complimentary Tickets
Custom Ticket Type Links
Marketing Tools - Sending an email campaign
Marketing Tools - Sending an SMS campaign
Setting Up Google Analytics Tracking
Integrating the Facebook Pixel
Howler Brand/CI/Style Guide
Embedded links
Create a QR code linking to your ticketing page
Sponsor Assigning Complimentary Tickets
Event Customisation
Event Page Customisation within the organiser portal
Premium Event Customisation
How to Optimize an Image
Going Cashless
Going Cashless with Howler
Howler RFID Wristband Design Template
Vendor fees - For organisers
Cashless Sales Reports
How to drive Online Topups for a Cashless event.
Cashless Customer Journey
Ticket Scanning
Reporting
Event Protect
Howler Backend - Active Admin
Howler Backend Active Admin
Howler Backend Active Admin - Manage Organiser Roles
Howler Backend Active Admin - Reps
Howler Backend Active Admin - GTM configuration
Howler Backend Active Admin - Create Ticket Types
Howler Backend Active Admin - Promo Codes
Howler Backend Active Admin - Create a Pre Registration Event
Howler Backend Active Admin - Unique Registration
Howler Backend Active Admin - Data Capture
Streaming Online Events
How to create an Online Streaming Event
How to enable Express Check-in for your event
Finding your stream URL
How to schedule a Facebook Live video stream - Using your computer
How to start a Facebook Live video stream - Using your mobile device
How to setup a private Zoom web conference
Pulse
Dashboard Guide 1.1. Ticketing Overview YoY Analysis
Dashboard Guide 1.2. Daily Sales Dashboard
Dashboard Guide 1.3. Ticket Type YoY Analysis
Dashboard Guide 1.4. Price YoY Analysis
Dashboard Guide 1.5. Payment YoY Analysis
Dashboard Guide 4. Audience YoY Analysis
Dashboard Guide 5. Abandoned Cart
Dashboard Guide 6.1.1. Event Sales Overview
Dashboard Guide 6.1.3. Bar Sales
Dashboard Guide 6.1.5. Event Sales Demographics
Dashboard Guide 6.3.1. Total Topups Overview YoY Analysis
Dashboard Guide 6.3.4. Total Topup Ticket Type YoY Analysis
Dashboard Guide 6.3.5. Total Topup Demographic
Dashboard Guide 6.1.4. Vendor Sales
Dashboard Guide 6.2. Cashless Check-Ins Dashboard
Dashboard Guide 6.1.6 Event Sales Ticket Type Analysis
Dashboard Guide 6.3.3. Onsite Topups YoY Analysis
Dashboard Guide 6.3.2. Online Topups YoY Analysis
Vendor at an event
Setting Up Your Vendor Account
Setting Up For An Event
Setting Up Your Menu
Editing Vendor Bank Details
How to use the Howler Cashless Point of Sales Devices - Training Video
Vendor Fees
Vendor Settlement
The Vendor Agreement
Vendor Sales Reports
Legal
Partners Resources
- All Categories
- Organising An Event
- Pulse
- Dashboard Guide 1.5. Payment YoY Analysis
Dashboard Guide 1.5. Payment YoY Analysis
 Updated
by Robyn Marais
Updated
by Robyn Marais
This dashboard provides a year-on-year comparative view of payment performance, highlighting trends in payment volume, methods, and order behavior across current and past events. It is designed to help teams track shifts in payment channel usage, manage operational risks related to refunds or layups, and support financial reconciliation and performance evaluation.
The dashboard enables comparison of total payments made, number of orders, average ticket per order, and total revenue generated via each payment method. It also includes detailed breakdowns of payment methods by local vs international usage, refunds and transfers, and layup orders by status.
This guide walks you through each key element of the dashboard to explain what the visuals represent and how to interpret the data effectively.
The dashboard enables you to:
- Track total payments made, orders, and average ticket quantity per order.
- Understand changes in revenue contribution across different payment types.
- Identify shifts in consumer preferences (e.g., credit card vs EFT vs LayUp).
- Review refunds, cancellations, and completed layups.
- Analyse order-level payment activity to resolve customer queries or audit records.
Days to go
At the top of the dashboard, you'll find a “Days to Go” figure to help orient the timeline view.
To ensure a like-for-like comparison between current and past events (even if their dates differ), adjust the “Days Before Event” filter to: is between [inclusive] the current days before value and 360. This aligns data points based on how many days remain before the event date to standardise comparison across events.
Current Event, Change, Past Event
This section presents comparison tiles for key performance indicators (KPIs):
- Total Payments Made
- Orders
- Average Ticket per Order
The visual tiles allow for a quick snapshot of current event performance against the equivalent time frame from the previous year to help you gauge if you’re ahead, behind, or on track.
Revenue by Payment Method
This bar chart breaks down gross revenue per payment method, enabling you to:
- See which methods are driving the most revenue.
- Identify trends in consumer payment preferences.
- Validate if alternative options (e.g., LayUp, PayAt) are gaining traction or need adjustment.
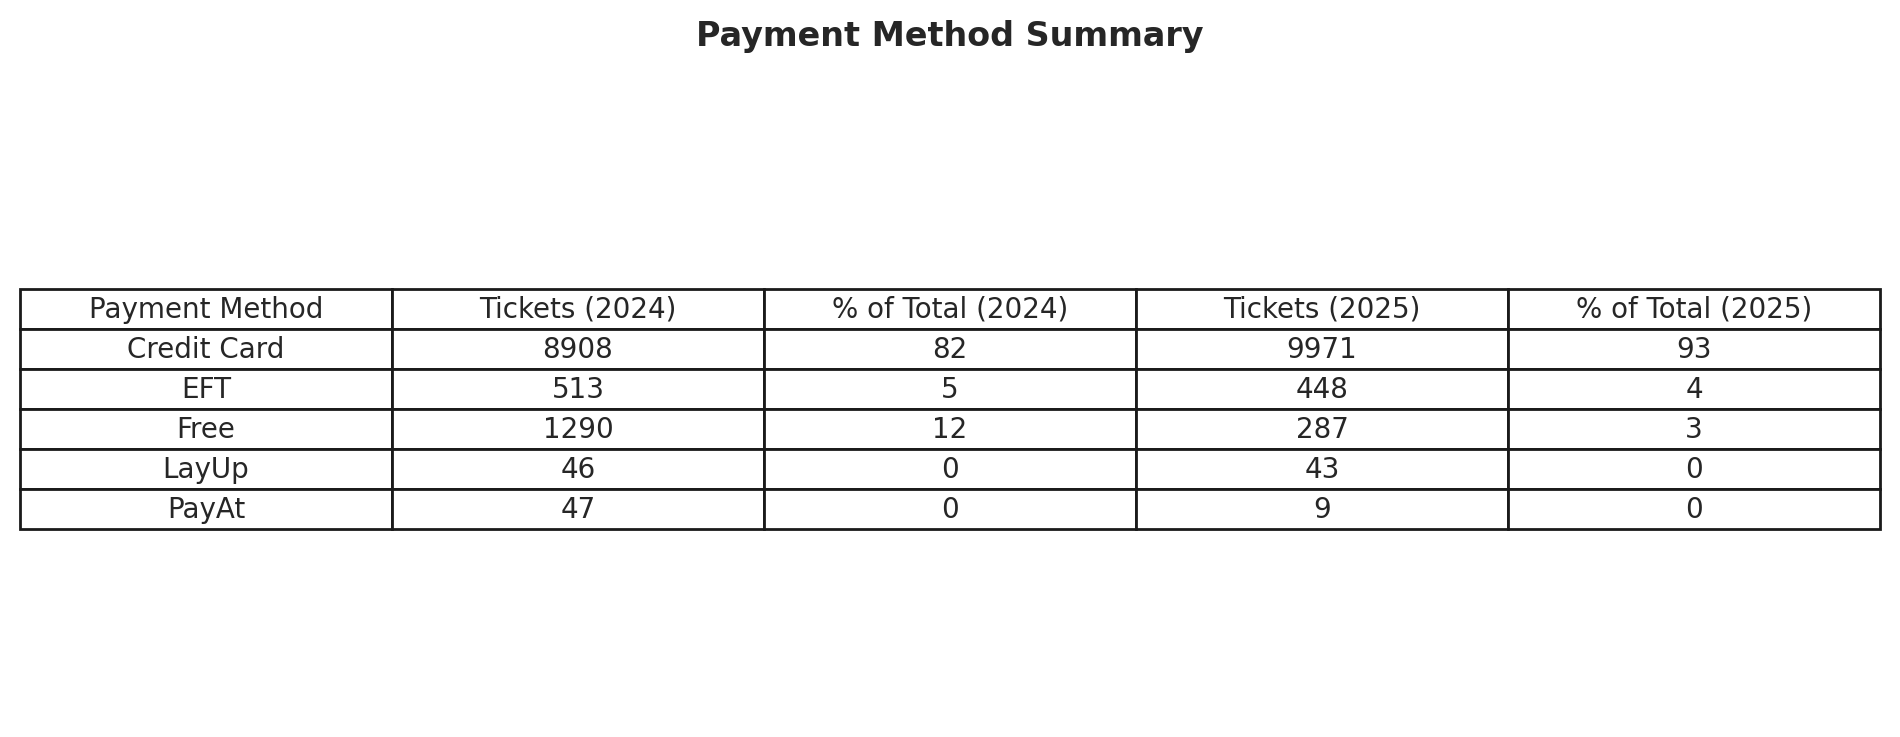
Payment Method
A tabular view that shows:
- Number of tickets sold per method
- % of Total contribution by each method
- Segmentation into local vs international payments
This is helpful to:
- Compare markets and currency flows
- Spot shifts in channel effectiveness
- Optimise for preferred methods in future event planning
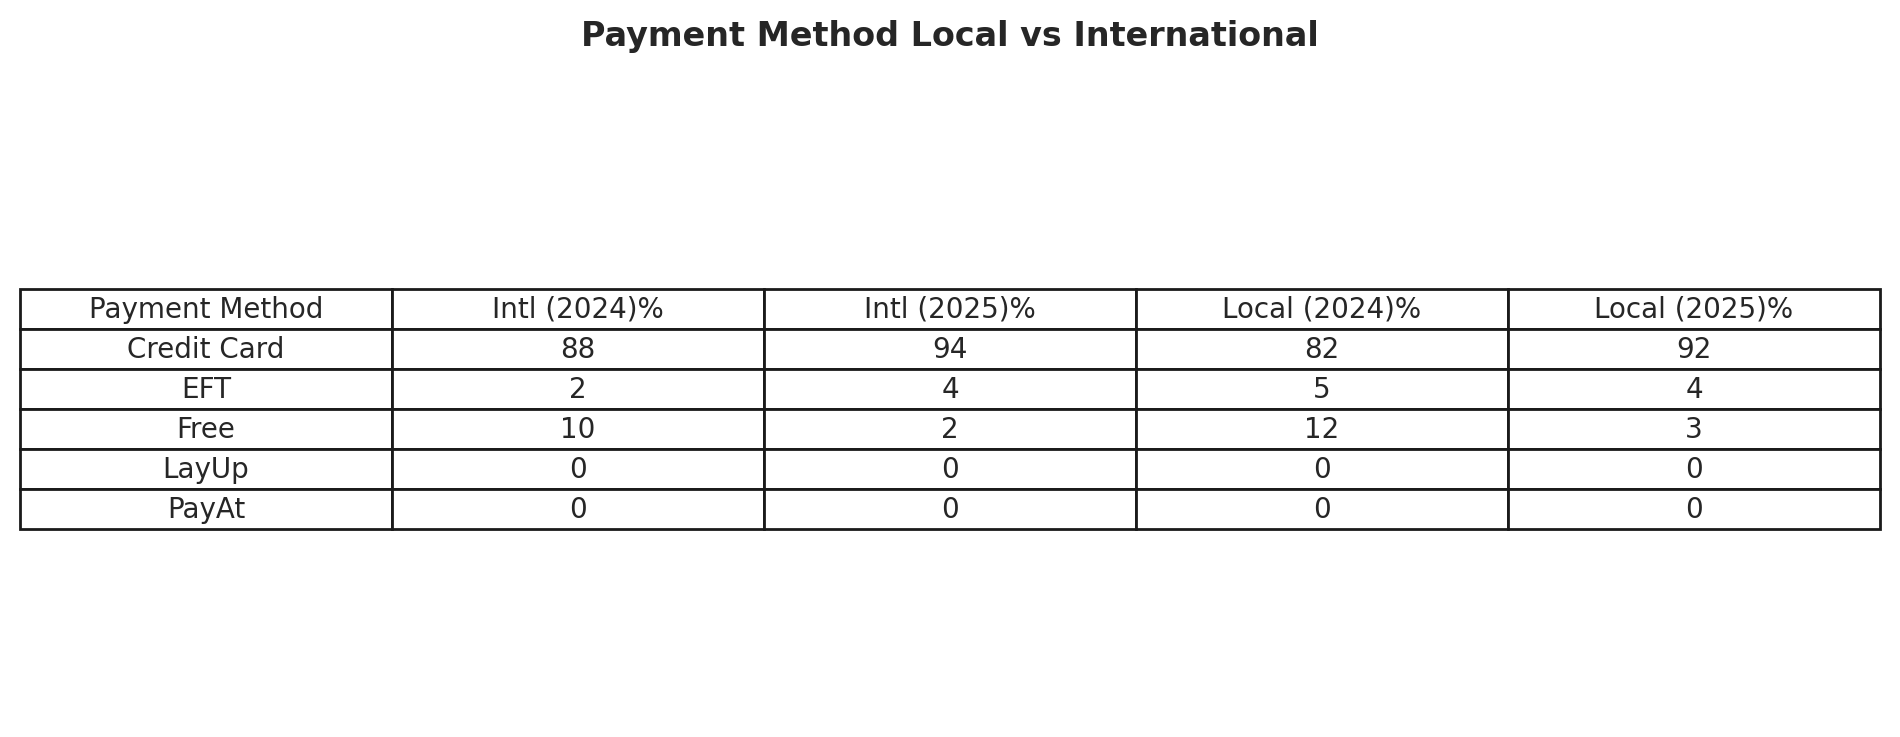
Payment Method Local v International
This section breaks down how customers are paying based on their geographic origin—comparing local (domestic) and international transactions by payment method.
What it shows:
- Each payment method (e.g., CallpayCreditCardPayment, CallpayEftPayment, FreePayment) is displayed.
- For both local and international customers, you’ll see:
- Ticket volume (%) – How much of the total came through each method.
- Comparative percentages – Helping you understand the relative popularity of each method by region.
Layup Ticket Types By Status
This table highlights how LayUp ticket types are performing—split by status:
- Complete
- Cancelled
You can evaluate:
- Which tiers are popular for layaway
- Drop-off or cancellation risks at the tier level
Use this to better plan future LayUp campaigns and inventory releases.
Tickets by Status
This section categorises tickets into:
- Active
- Pending Assignment
- Refunded
- Transferred
It enables quick validation of fulfilment and refund processing and helps monitor operational efficiency and customer satisfaction.
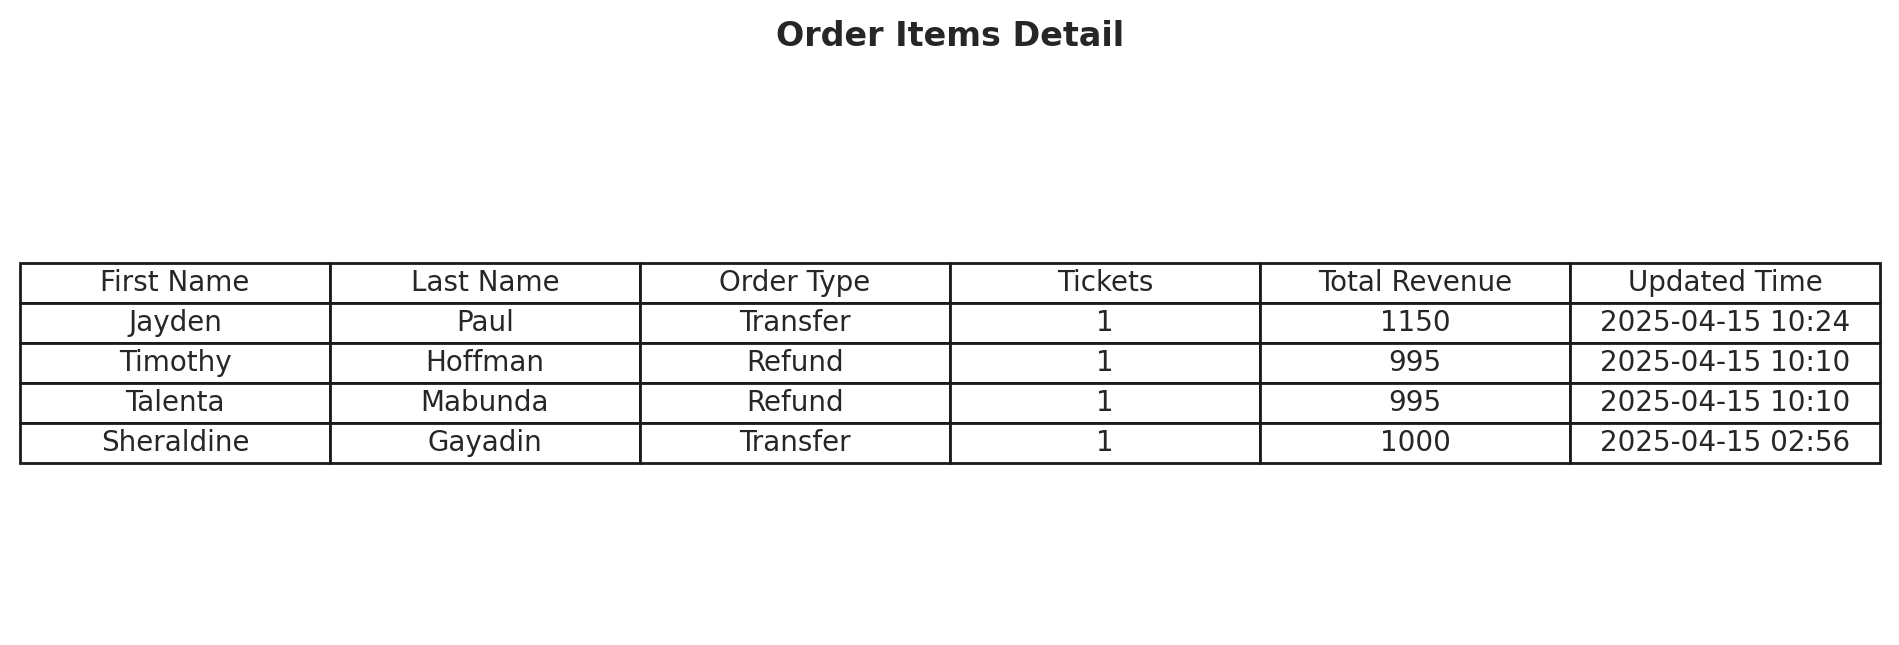
Order Items Detail
This transactional-level detail gives visibility into:
- Customer names
- Order types (e.g. transfer, refund, ticket)
- Time stamps and revenue per item
This is especially useful for:
- Resolving support tickets
- Performing manual audits
- Tracking unusual activity (e.g., bulk transfers or refund surges)
🙋 FAQs
Q: Are refunds included in payment totals?
A: No – refunded tickets are excluded from totals unless the dashboard explicitly includes refund metrics.
Q: What does “Transferred” mean under ticket status?
A: It refers to tickets that have been successfully moved to another user account (e.g., using ticket transfer tools).
Q: Can I filter this by international vs local payments?
A: Yes – use the Payment Method (Country Split) section and filters to isolate data by market.