Attending An Event
Account Settings
Billing and Payment
Account Settings
Delete Your Account
Link Facebook or Google
ID or Passport Number Not Valid
Edit Details on Your Profile
Privacy and Security
Tickets
Cashless
Howler Active
Organising An Event
Getting Started
Video Tutorial - Getting Started
Organiser Approval Process
Getting Started with Howler
Our Services
Getting Paid
Howler Customer Support
Payment Gateway Options - For organisers
Manage your account
Setup your event
How to create an event
How to Make My Event Searchable on Howler.co.za
Event Look and Feel
Ticket Type Settings
How to enable donations for your event
Express Checkin
Enable Ticket Resale for your Event
Marketing Tools
Ticket Reps
How to drive ticket sales
Ticket Bundles and Specials
Issue Complimentary Tickets
Custom Ticket Type Links
Marketing Tools - Sending an email campaign
Marketing Tools - Sending an SMS campaign
Setting Up Google Analytics Tracking
Integrating the Facebook Pixel
Howler Brand/CI/Style Guide
Embedded links
Create a QR code linking to your ticketing page
Sponsor Assigning Complimentary Tickets
Event Customisation
Event Page Customisation within the organiser portal
Premium Event Customisation
How to Optimize an Image
Going Cashless
Going Cashless with Howler
Howler RFID Wristband Design Template
Vendor fees - For organisers
Cashless Sales Reports
How to drive Online Topups for a Cashless event.
Cashless Customer Journey
Ticket Scanning
Reporting
Event Protect
Howler Backend - Active Admin
Howler Backend Active Admin
Howler Backend Active Admin - Manage Organiser Roles
Howler Backend Active Admin - Reps
Howler Backend Active Admin - GTM configuration
Howler Backend Active Admin - Create Ticket Types
Howler Backend Active Admin - Promo Codes
Howler Backend Active Admin - Create a Pre Registration Event
Howler Backend Active Admin - Unique Registration
Howler Backend Active Admin - Data Capture
Streaming Online Events
How to create an Online Streaming Event
How to enable Express Check-in for your event
Finding your stream URL
How to schedule a Facebook Live video stream - Using your computer
How to start a Facebook Live video stream - Using your mobile device
How to setup a private Zoom web conference
Pulse
Dashboard Guide 1.1. Ticketing Overview YoY Analysis
Dashboard Guide 1.2. Daily Sales Dashboard
Dashboard Guide 1.3. Ticket Type YoY Analysis
Dashboard Guide 1.4. Price YoY Analysis
Dashboard Guide 1.5. Payment YoY Analysis
Dashboard Guide 4. Audience YoY Analysis
Dashboard Guide 5. Abandoned Cart
Dashboard Guide 6.1.1. Event Sales Overview
Dashboard Guide 6.1.3. Bar Sales
Dashboard Guide 6.1.5. Event Sales Demographics
Dashboard Guide 6.3.1. Total Topups Overview YoY Analysis
Dashboard Guide 6.3.4. Total Topup Ticket Type YoY Analysis
Dashboard Guide 6.3.5. Total Topup Demographic
Dashboard Guide 6.1.4. Vendor Sales
Dashboard Guide 6.2. Cashless Check-Ins Dashboard
Dashboard Guide 6.1.6 Event Sales Ticket Type Analysis
Dashboard Guide 6.3.3. Onsite Topups YoY Analysis
Dashboard Guide 6.3.2. Online Topups YoY Analysis
Vendor at an event
Setting Up Your Vendor Account
Setting Up For An Event
Setting Up Your Menu
Editing Vendor Bank Details
How to use the Howler Cashless Point of Sales Devices - Training Video
Vendor Fees
Vendor Settlement
The Vendor Agreement
Vendor Sales Reports
Legal
Partners Resources
- All Categories
- Organising An Event
- Pulse
- Dashboard Guide 6.1.1. Event Sales Overview
Dashboard Guide 6.1.1. Event Sales Overview
 Updated
by Robyn Marais
Updated
by Robyn Marais
This dashboard provides a comprehensive overview of total event sales performance, ticket category sales breakdowns, and spending behavior for the current event. It is designed to help stakeholders track sales distribution across ticket types, analyze transaction volumes, and assess sales channel efficiency (e.g. closed vs open loop).
The dashboard highlights key metrics such as total event sales, bar and vendor sales contributions, and average attendee spending, helping event organizers and partners evaluate the commercial performance of the event in real-time.
Additional insights are provided through views of top-performing bars and vendors, hourly sales trends, and category-level performance, enabling agile operational and strategic decision-making.
This guide walks you through each key element of the dashboard to explain what the visuals represent and how to interpret the data effectively.
The dashboard enables you to:
- Track total product sales and transaction volume
- Compare sales performance by ticket/product category
- Monitor vendor and bar performance
- Identify peak sales times for staffing and stock planning
- Analyse consumer spending patterns on-site
Key Metrics
Total Event Sales: Total gross revenue across bars and vendors.
Total Transactions: Number of purchase events.
Total Bar Sales: Bar contribution to total revenue.
Total Vendor Sales: Vendor contribution to total revenue.
Average Spend per Attendee: Total spend divided by number of attendees.
Average Order per Person: Total transactions divided by attendees.
Average Spend per Attendee: Bar: Breakdown of where attendees are spending more.
Average Spend per Attendee: Vendor: Breakdown of where attendees are spending more.
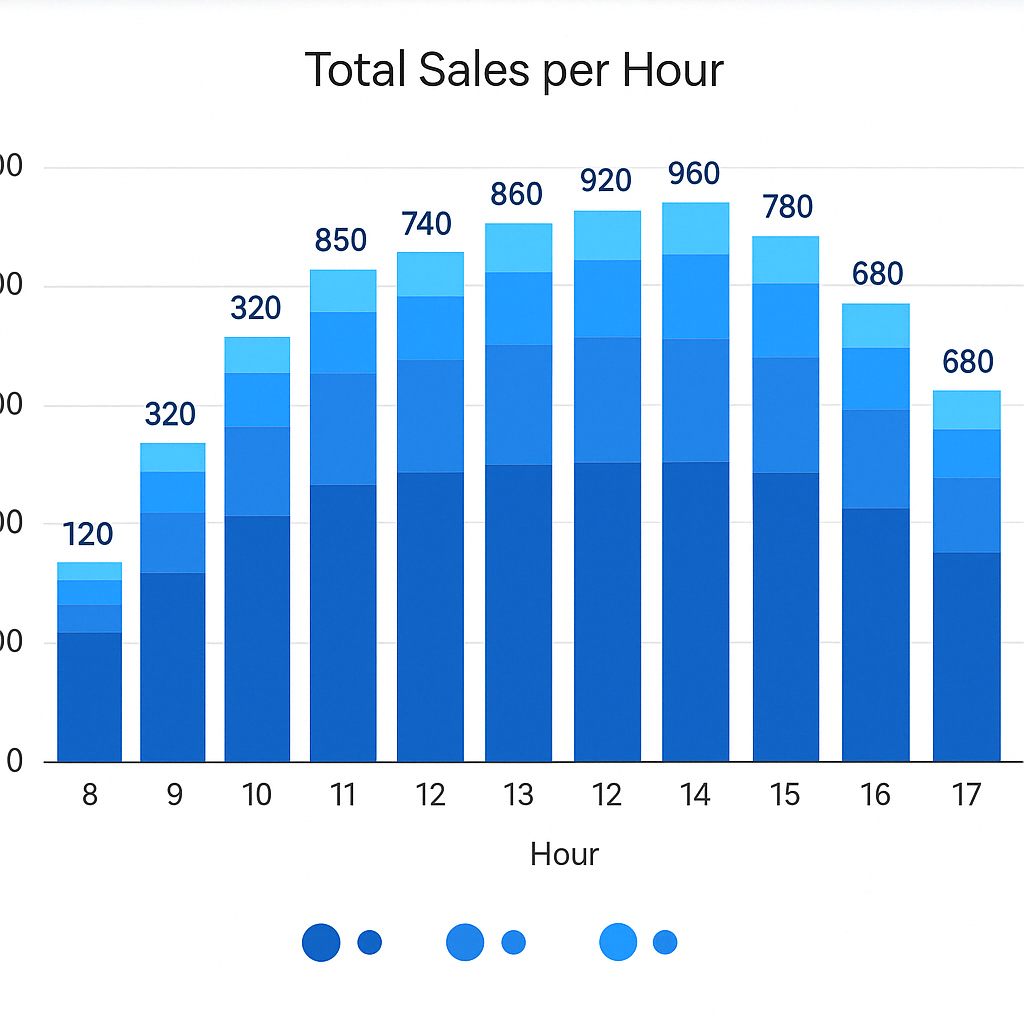
Total Sales per Hour
Shows hourly breakdown of sales, segmented by bar and vendor categories.
How to use it:
- Identify peak demand times to optimise staffing and logistics.
- Plan happy hours or targeted promotions during low-performing slots.
- Enhance guest experience through reduced wait times and better service during busy hours.
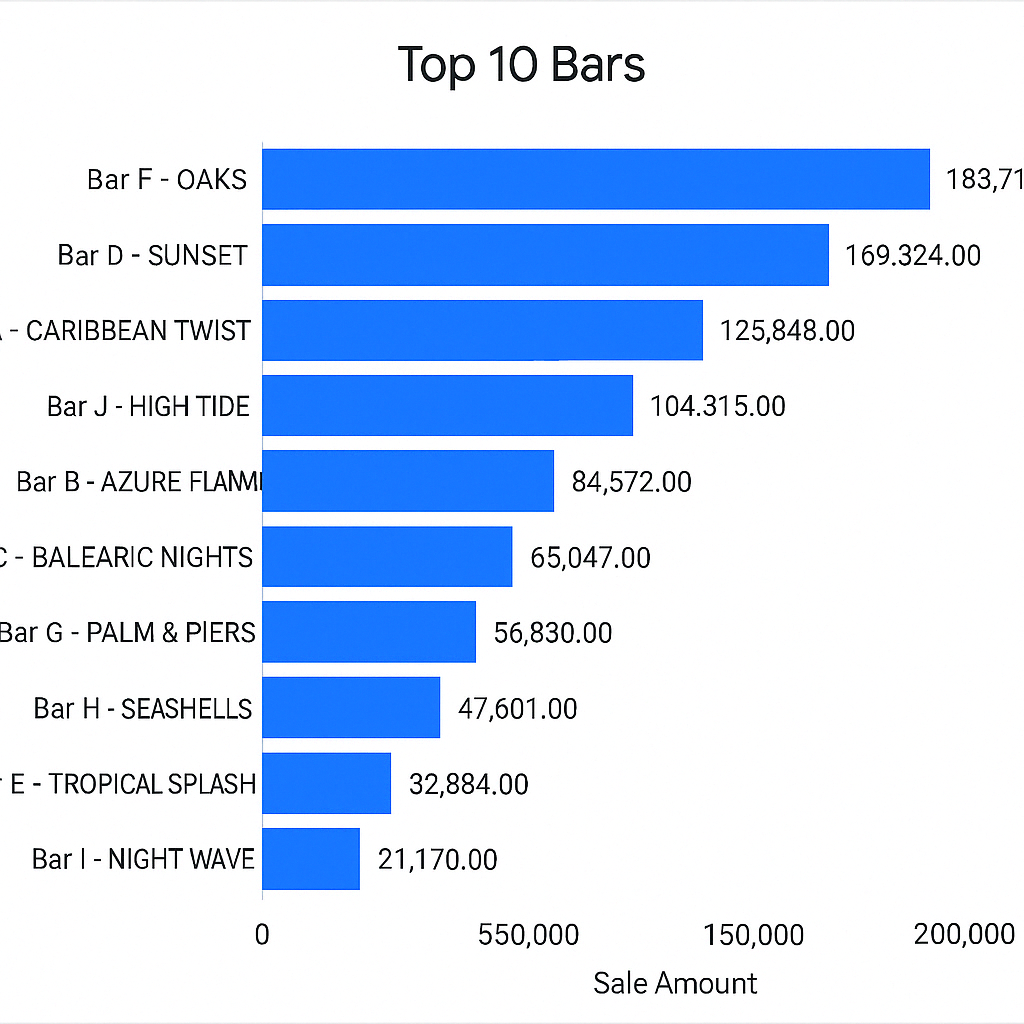
Top 10 Bars
Ranks the top 10 bar locations based on total sales revenue.
How to use it:
- Identify high-performing bars for future placement or investment.
- Guide resourcing, restocking, and staff allocation.
- Understand customer behavior by location.
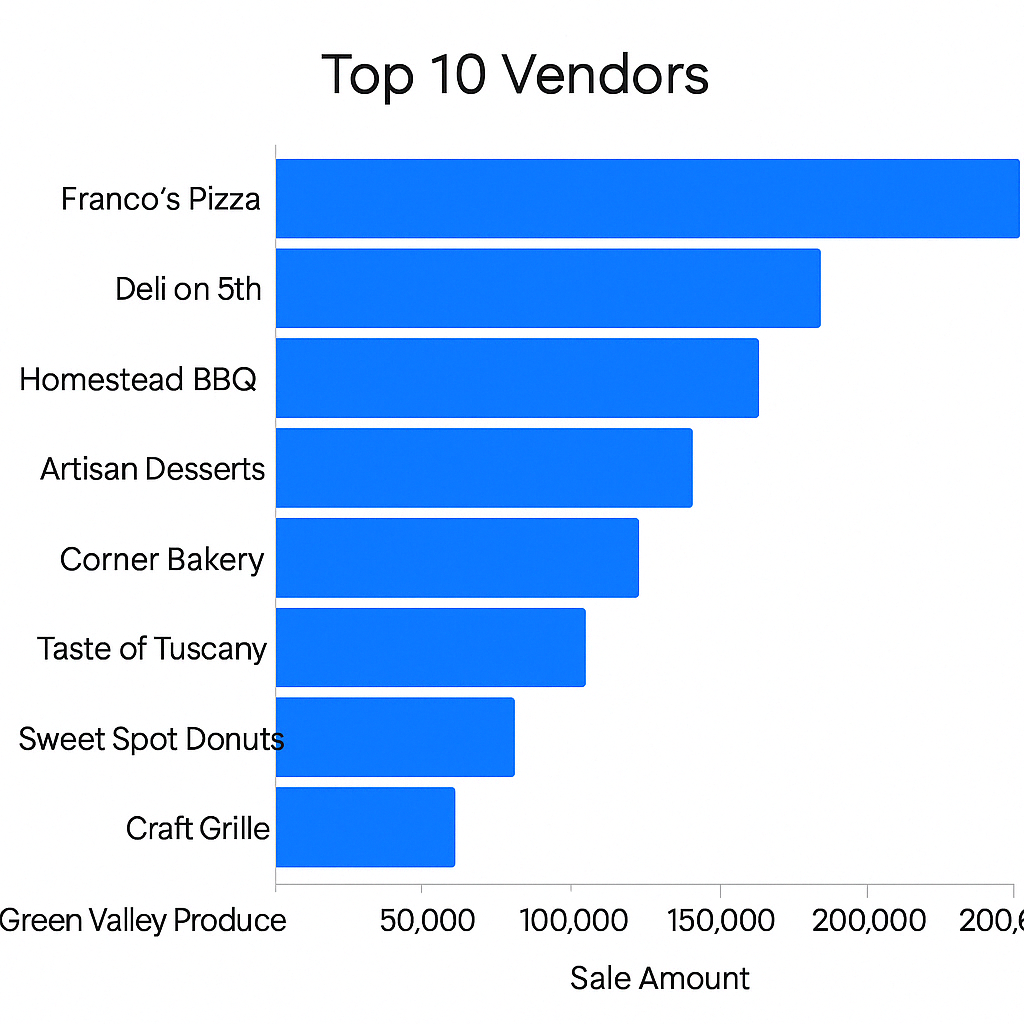
Top 10 Vendors
Highlights the highest-grossing food and merchandise vendors on-site.
How to use it:
- Track vendor performance in real time.
- Reward high performers or address underperformance.
- Use for vendor evaluation and future event planning.
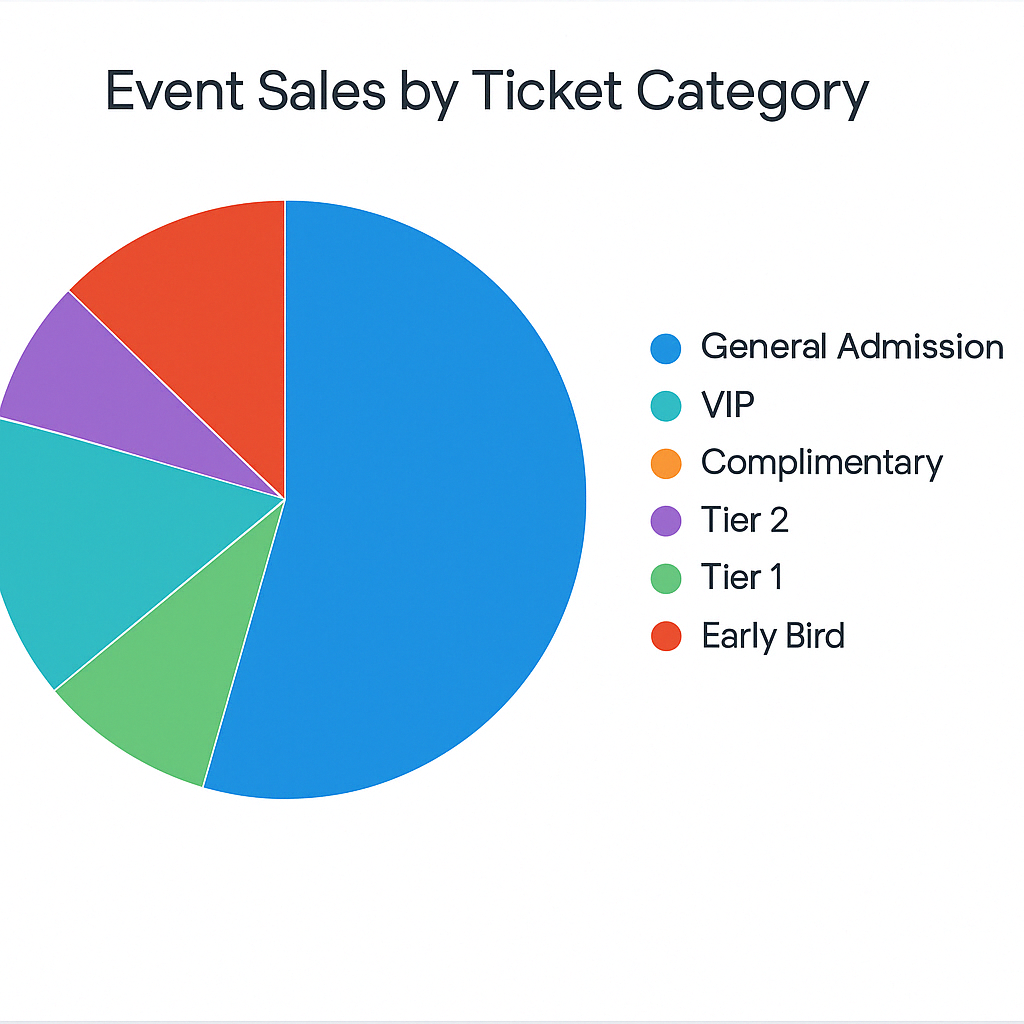
Event Sales By Ticket Category
This visual displays the distribution of product sales sales across all ticket categories for the selected event. Each slice of the pie represents a ticket category (e.g., General Access, VIP Access), with its share (%) of total sales.
How to Use:
- Identify which ticket types are driving the majority of product sales.
- Understand the popularity of premium vs. standard options.
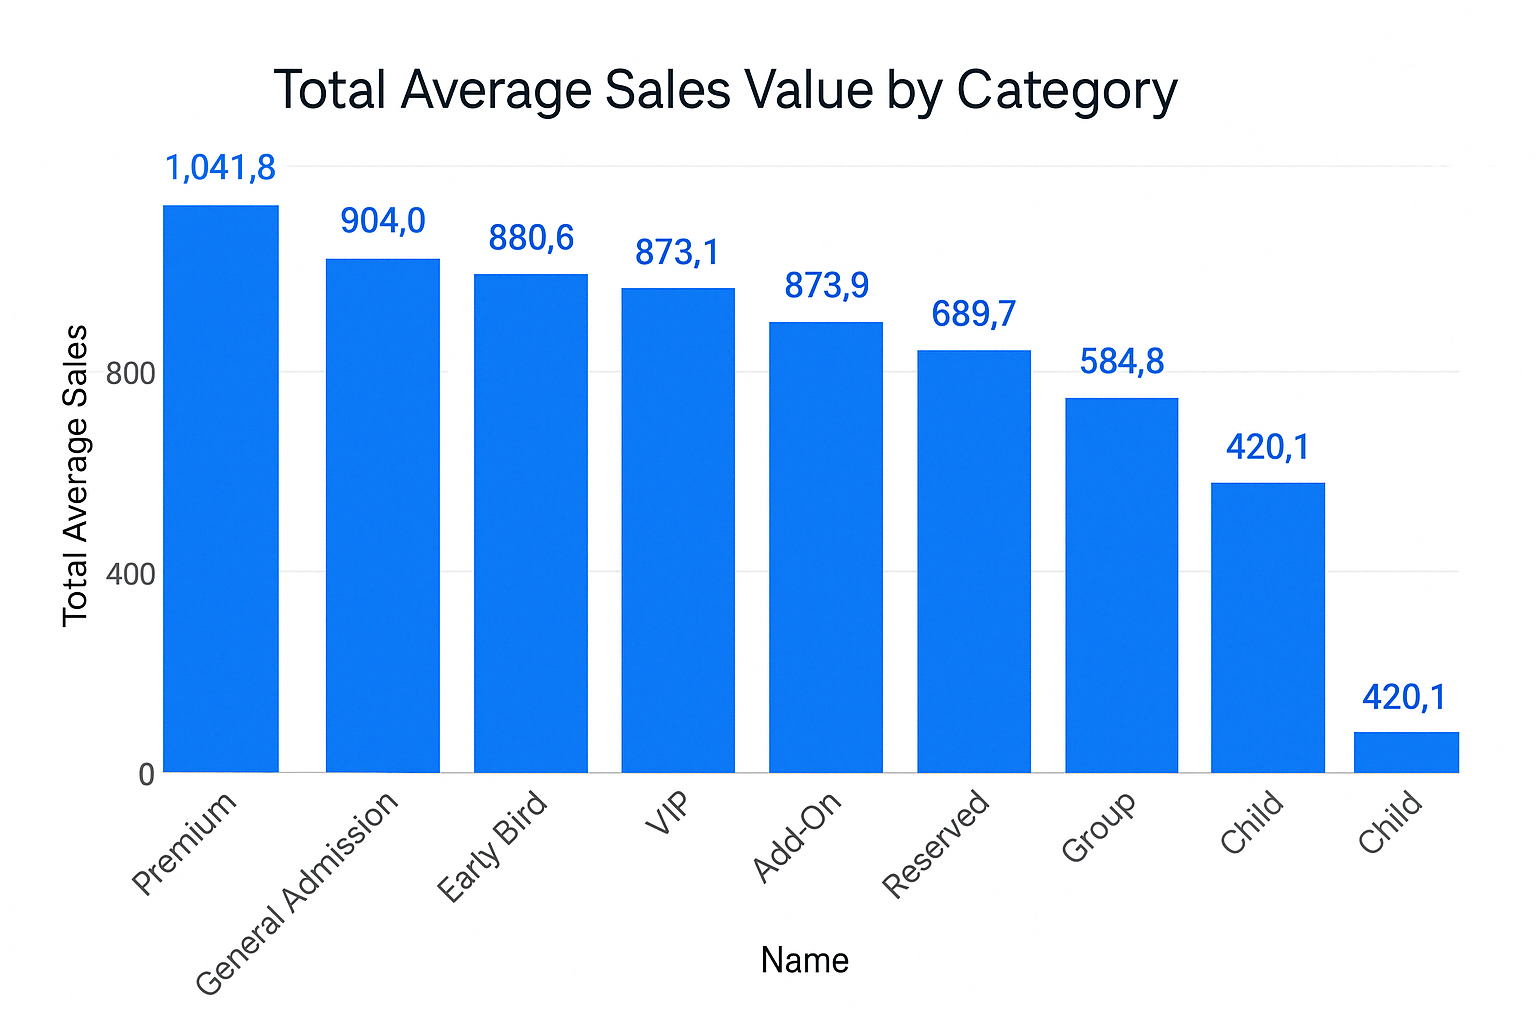
Average Spend per person by Ticket Category
Displays the average sales value per ticket category, giving insight into the per-customer value of each Ticket Category.
How to use it:
- Identify which ticket categories yield the highest return per person.
Event Sales by Payment Method
This chart shows the total value of sales processed through each payment method, typically segmented into:
- Closed Loop (RFID wristbands)
- Open Loop (credit/debit card AnyPay solution)
How to use it:
- Measure adoption of on-site payment infrastructure.
- Evaluate friction points in the payment process.
- Make informed decisions about payment platform investment.