Dashboard Guide 4. Audience YoY Analysis
 Updated
by Robyn Marais
Updated
by Robyn Marais
This dashboard provides a year-on-year comparative analysis of audience demographics, behaviors, and engagement metrics. There are two reports to report on ticket purchasers and Users. You can access the Users report from the Purchasers report and vice versa. It is used to assess how customer profiles are shifting across events, offering insights into buyer/attendee age, gender, location, and repeat purchasing behavior.
A purchaser is the individual who buys a ticket(s), while a user is the person who is assigned a ticket. These roles can be the same person, but often differ, for example, a purchaser buying tickets for a group of friends or family. We report on them separately because their motivations, behaviors, and experiences can vary significantly; understanding both helps us tailor marketing, improve user experience, and optimize product offerings to meet the needs of each group effectively.
The analysis supports marketing and audience segmentation strategies by tracking changes in customer composition, identifying new growth markets, and optimizing communication preferences based on demographic shifts.
This guide walks you through each key element of the dashboard to explain what the visuals represent and how to interpret the data effectively.
The dashboard enables you to:
- Analyse age, gender, and location trends across events
- Understand shifts in customer acquisition and retention
- Measure audience engagement and conversion patterns
- Use demographic insights to guide targeted marketing and sponsorship strategies
Days to go
At the top of the dashboard, you'll find a “Days to Go” figure to help orient the timeline view.
To ensure a like-for-like comparison between current and past events (even if their dates differ), adjust the “Days Before Event” filter to: is between [inclusive] the current days before value and 360. This aligns data points based on how many days remain before the event date to standardise comparison across events.
Key Metrics
Total Tickets: Total number of tickets sold to date.
Total Customers: Total number of ticket holders.
Total Purchasers: Total number of ticket purchasers.
Allow Email: Number of customers who have selected to allow email communication for promotional purposes.
Allow SMS: Number of customers who have selected to allow SMS communication for promotional purposes.
Returning Customers: Number of returning customers from the previous event that have purchased tickets for the current event as a number and a % of total ticket sales.
New Customers: Number of new customers who did not attend the previous event that have purchased tickets for the current event as a number and a % of total ticket sales.
Average Ticket Per Purchaser: Average number of tickets purchased per purchaser.
Average Age: The average age of customers of your event.
Top Purchaser City % Change: How many more or less tickets have been sold to customers from your top performing city.
Top Age Group % Change: How many more or less tickets have been sold to customers from your top performing age group.
Top Gender % Change: How many more or less tickets have been sold to customers from your top performing gender.
Average Age % Change: By what percentage has the average age of your customers increased or decreased since your last event.
Query Insights
This AI-generated narrative provides instant context based on the visualisations that follow, in this case the Tickets Sales by Top 10 Countries data.
- This offers a natural language summary of key trends.
- It eliminates the need for manual interpretation of graphs.
- The purpose is to clearly communicate which Top 10 Countries are trending over time relative to the same period last year.
Tickets Sales by Top 10 Countries YoY
Tracks geographic origin of purchases—great for measuring international growth.
- Identify top-performing locations to focus marketing spend
- Support geo-targeted promotions or pop-ups
- Identify International Marketing growth or decline
Tickets Sales by Top 10 Cities YoY
Compares top-performing cities between events.
- Identify top-performing locations to focus marketing spend
- Support geo-targeted promotions or pop-ups
- Compare city-level performance sales to the current/past event
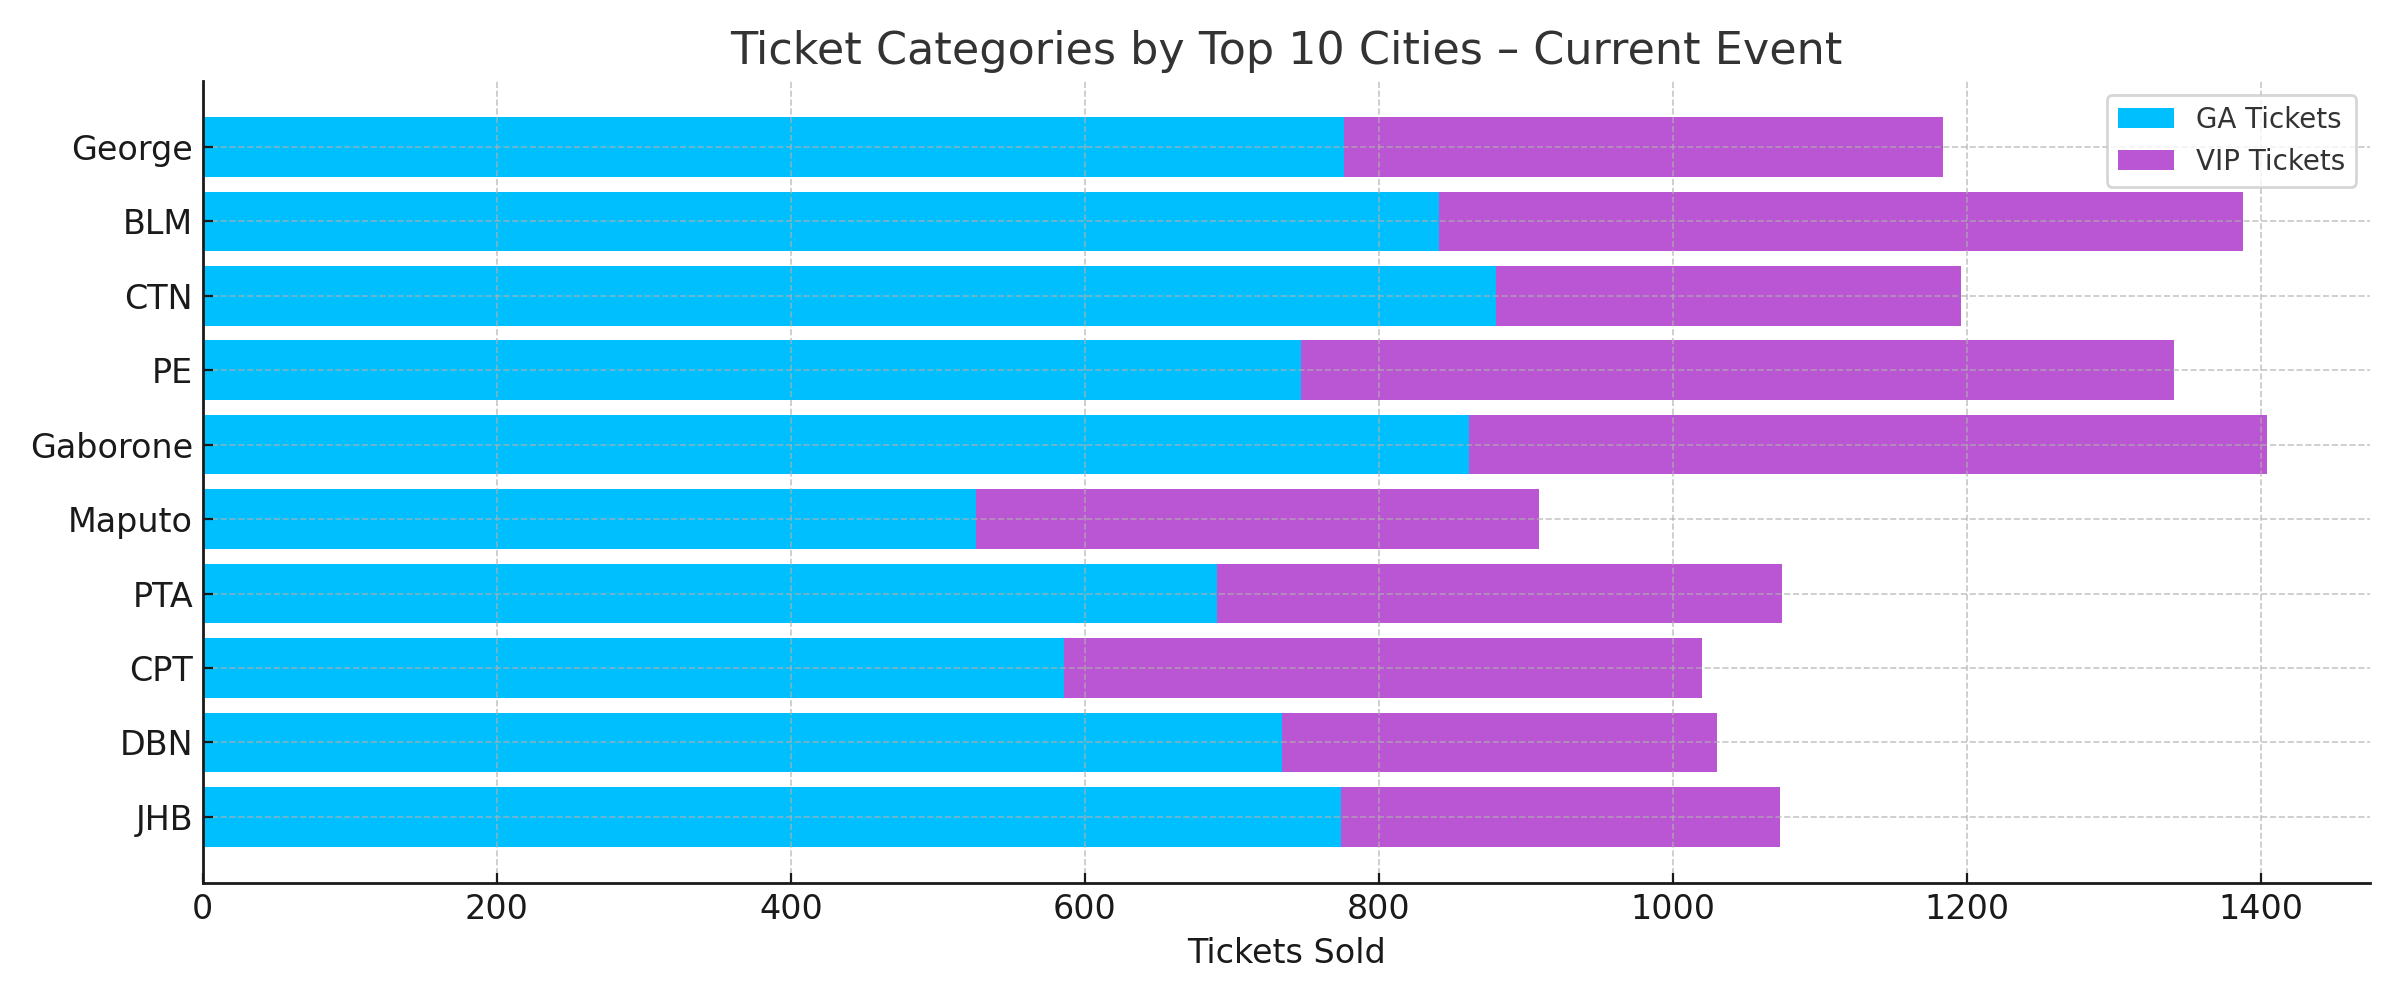
Ticket Category's by Top 10 Cities Current Event
Split by current and past event, showing how ticket types vary by region for the Current Event.
- Identify top-performing locations to focus marketing spend
- Support geo-targeted promotions or pop-ups
- Align inventory or distribution with city-level demand
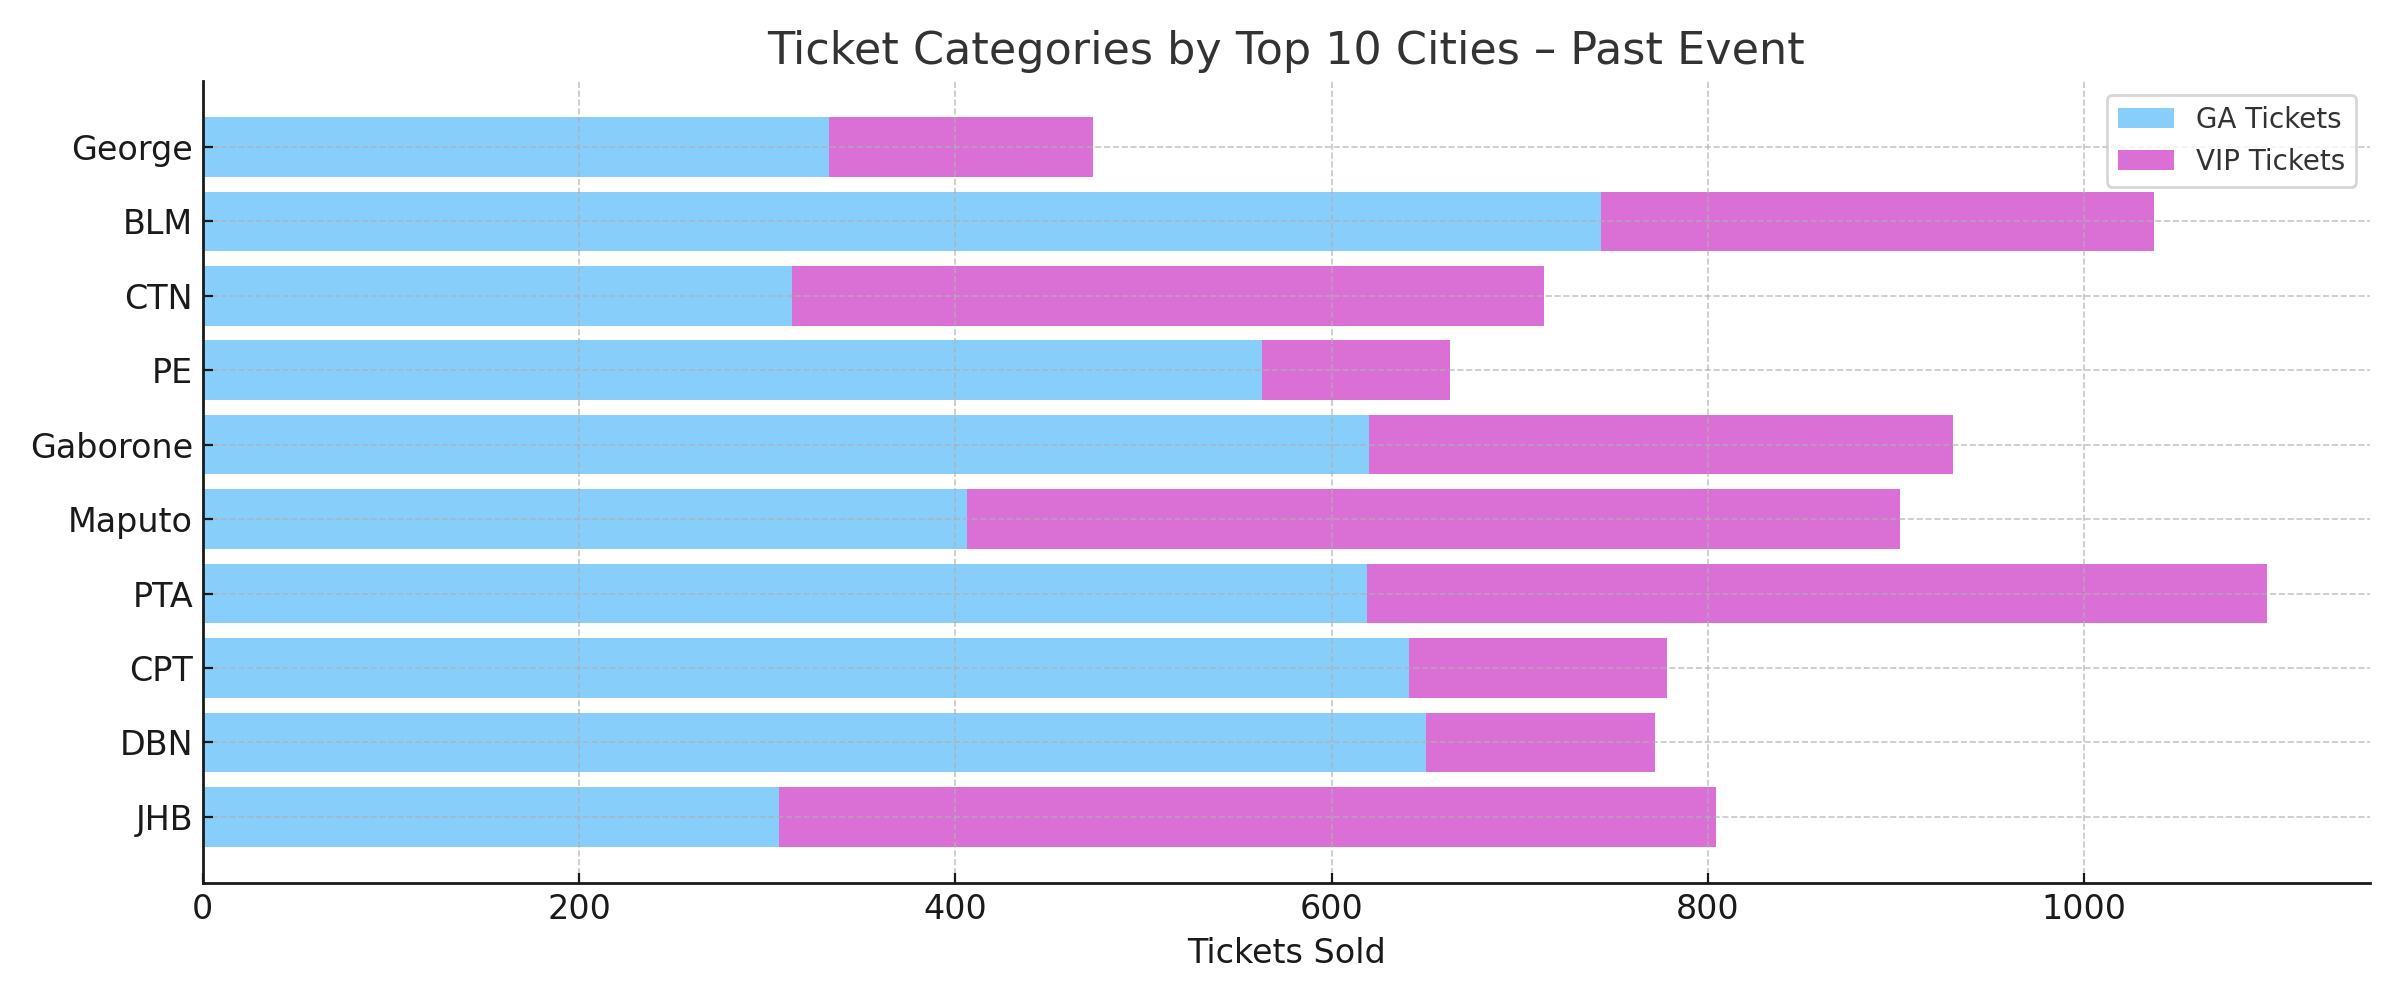
Ticket Category's by Top 10 Cities Past Event
Split by current and past event, showing how ticket types vary by region for the Past Event.
- Identify top-performing locations to focus marketing spend
- Support geo-targeted promotions or pop-ups
- Compare city-level performance of Ticket Category sales to the current/past event
Query Insights
This AI-generated narrative provides instant context based on the visualisations that follow, in this case the Tickets Sold by Age Group data.
- This offers a natural language summary of key trends.
- It eliminates the need for manual interpretation of graphs.
- The purpose is to clearly communicate which Age Groups are trending over time relative to the same period last year.
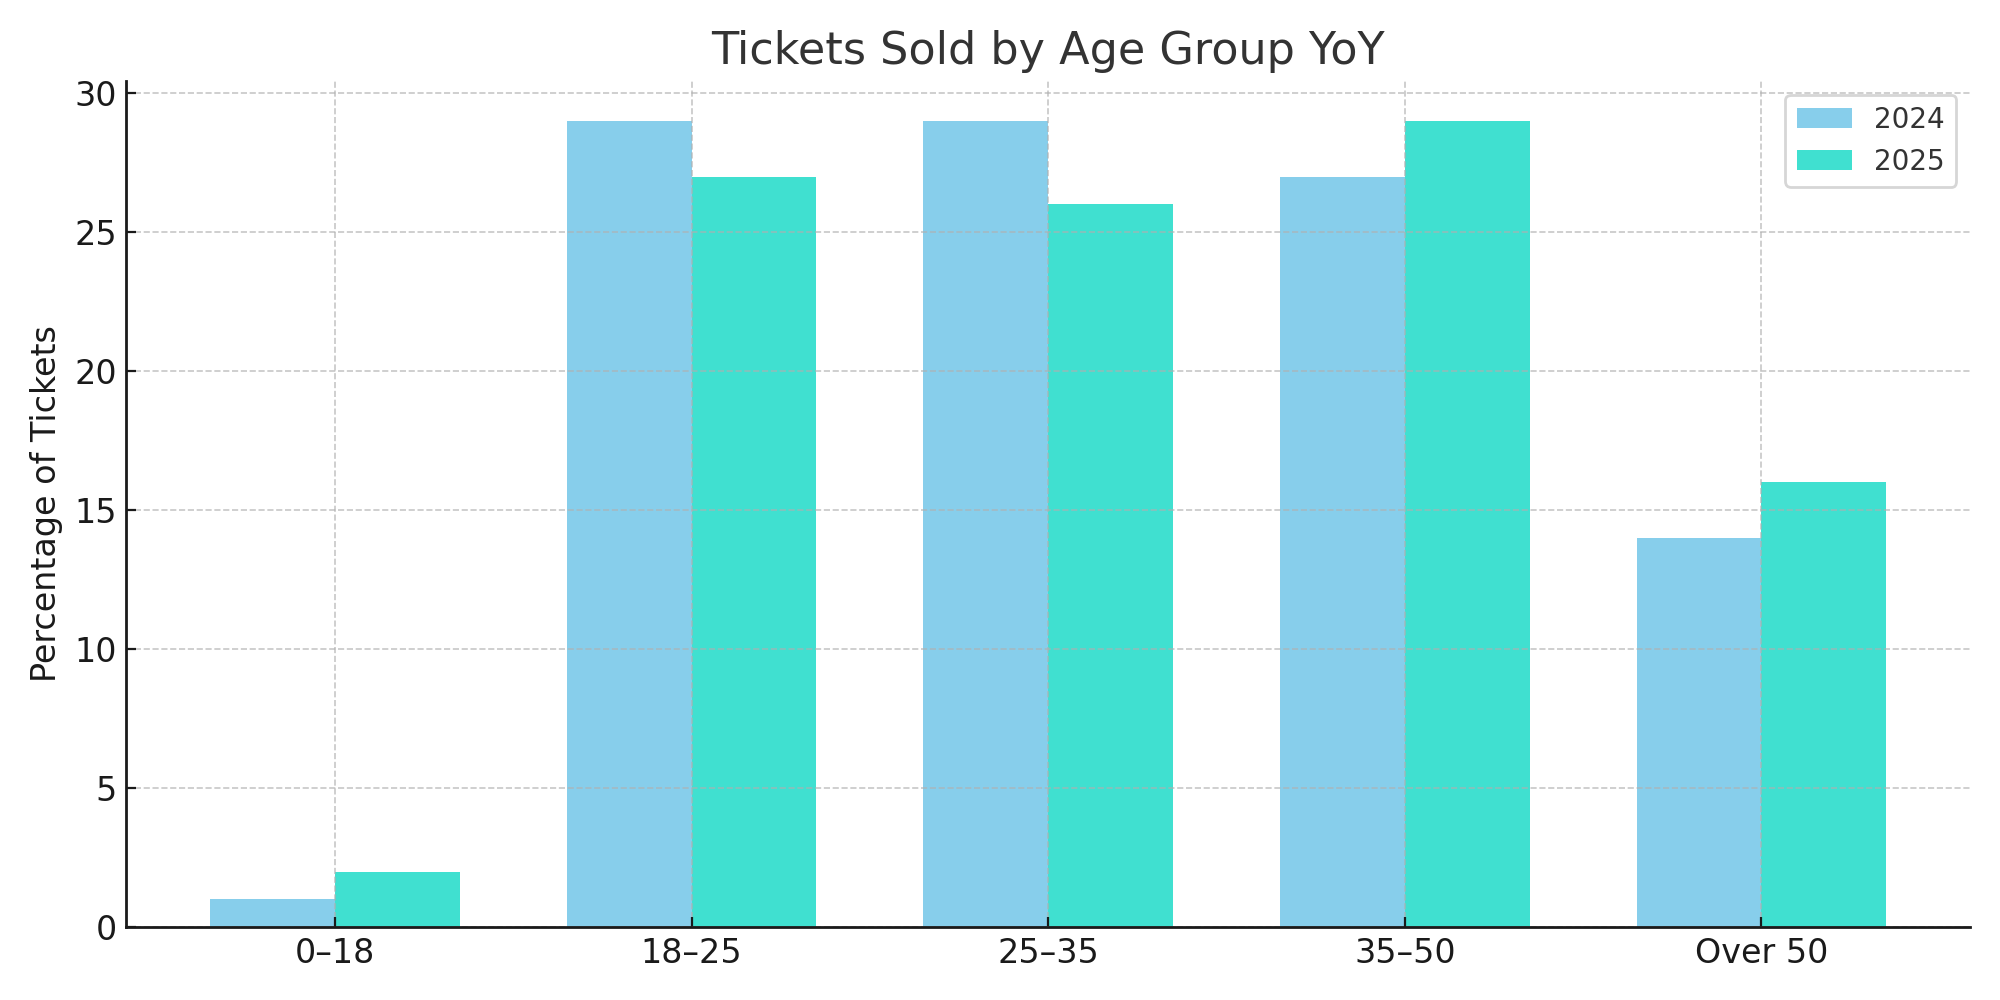
Tickets Sold by Age Group YoY
A vertical bar chart showing the percentage distribution of tickets sold by age group (e.g., 0–18, 18–25, 25–35, 35–50, Over 50) across the current and past event years.
How to use it:
- Understand which age segments are most engaged with your event
- Identify emerging age groups that may warrant tailored promotions or experiences
- Compare year-over-year growth or decline in specific age brackets to guide future programming, partnerships, or pricing
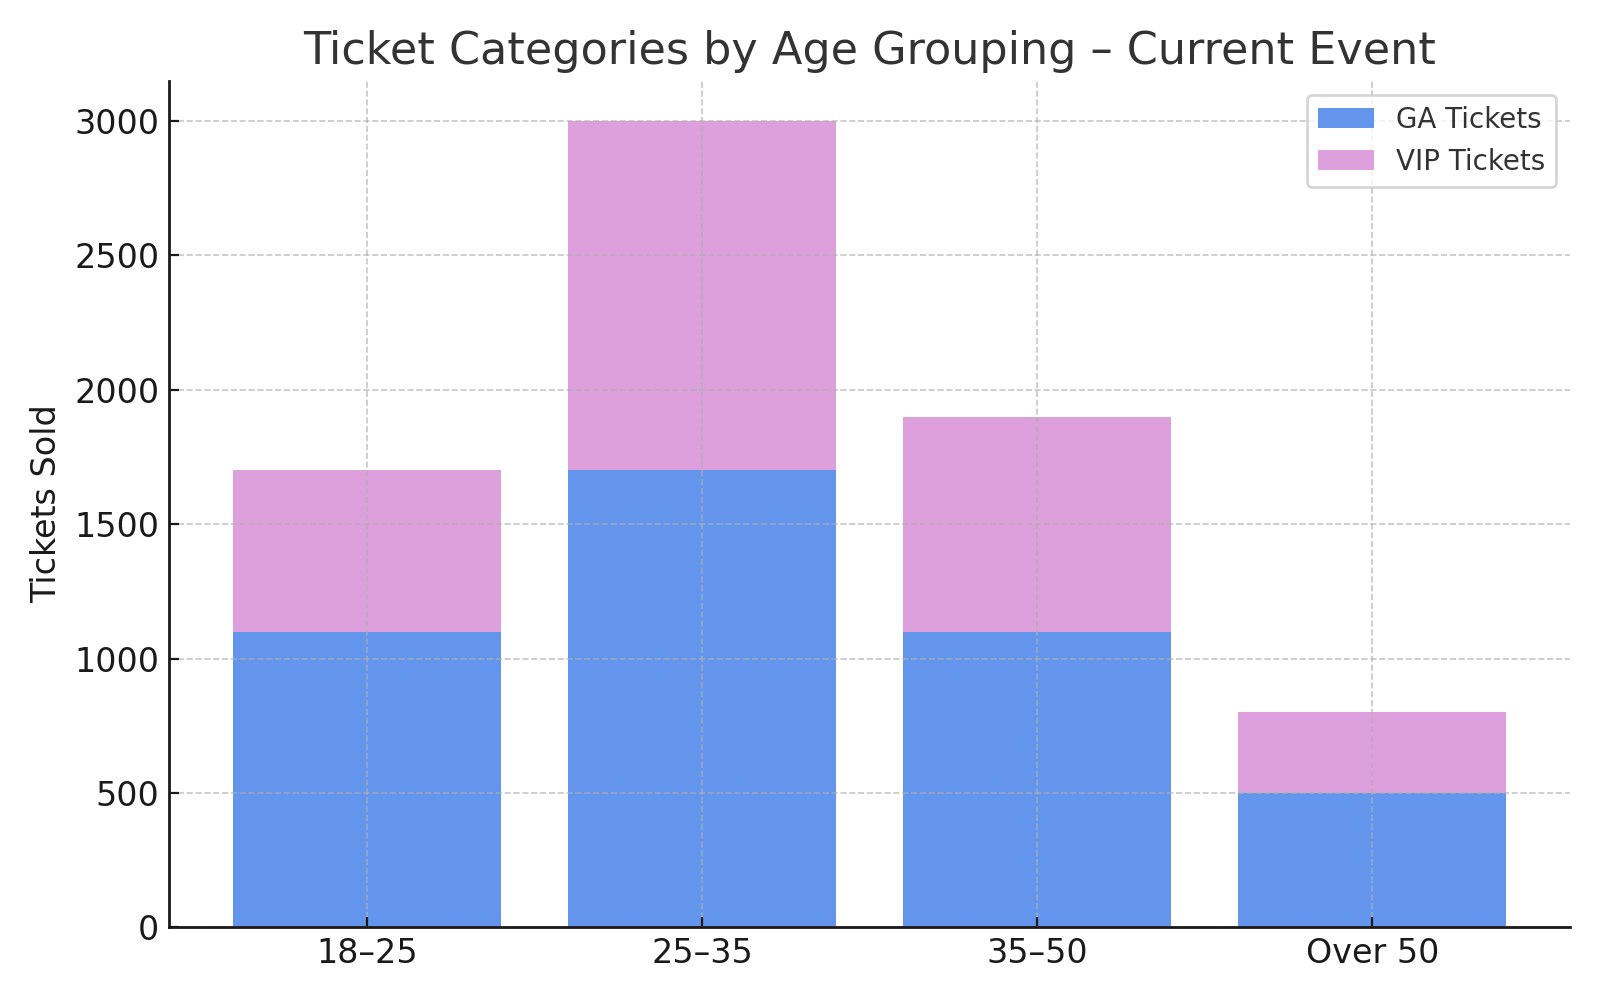
Ticket Categories by Age Grouping - Current Event
Bar charts showing which age groups purchased which ticket categories across the Current Event.
How to use it:
- Pinpoint shifts in audience makeup across age ranges
- Spot growing or shrinking demographics
- Target specific age groups with category-specific campaigns or offers
- Determine whether you’re reaching a younger or older demographic over time
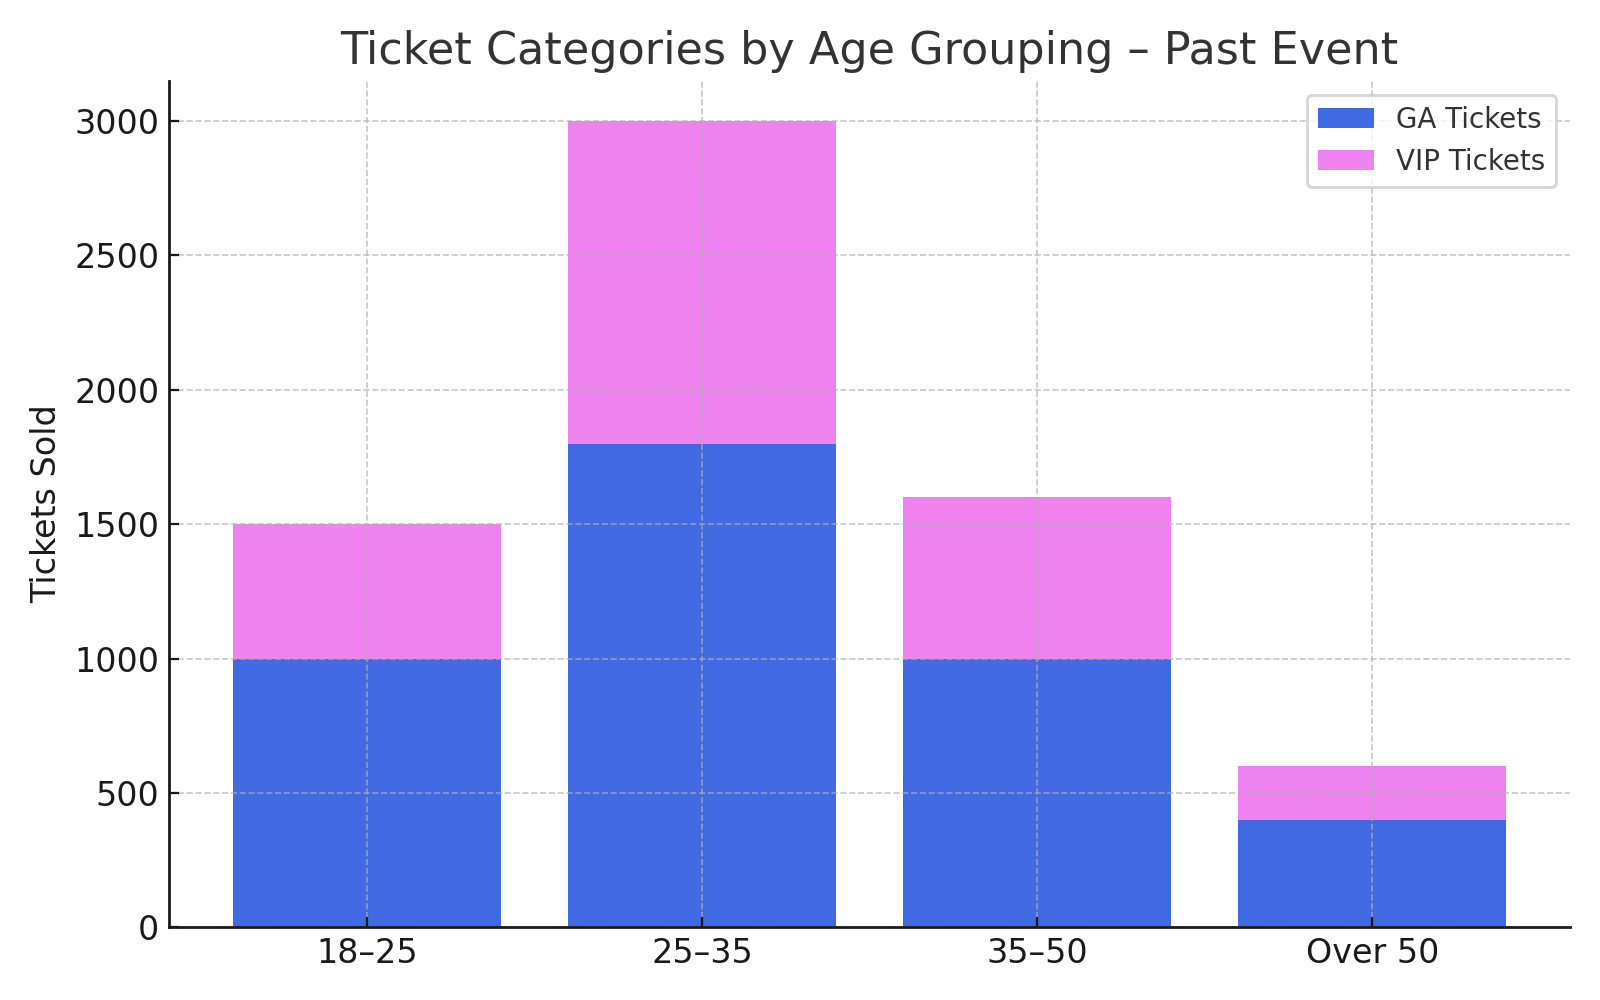
Ticket Categories by Age Grouping - Past Event
Bar charts showing which age groups purchased which ticket categories across the Past Event.
How to use it:
- Pinpoint shifts in audience makeup across age ranges for the current and past event.
- Spot growing or shrinking demographics across the current and past event.
- Determine whether you’re reaching a younger or older demographic over time
Query Insights
This AI-generated narrative provides instant context based on the visualisations that follow, in this case the Tickets Sold by Age Group and Gender data.
- This offers a natural language summary of key trends.
- It eliminates the need for manual interpretation of graphs.
- The purpose is to clearly communicate which Age Groups and Genders are trending over time relative to the same period last year.
Tickets Sold by Age Group Current and Past Event
Bar charts tracking cumulative ticket sales per ticket type by age group, for the current event and past event.
How to use it:
- Understand which age groups are buying different ticket types
- Determine whether you’re reaching a younger or older demographic
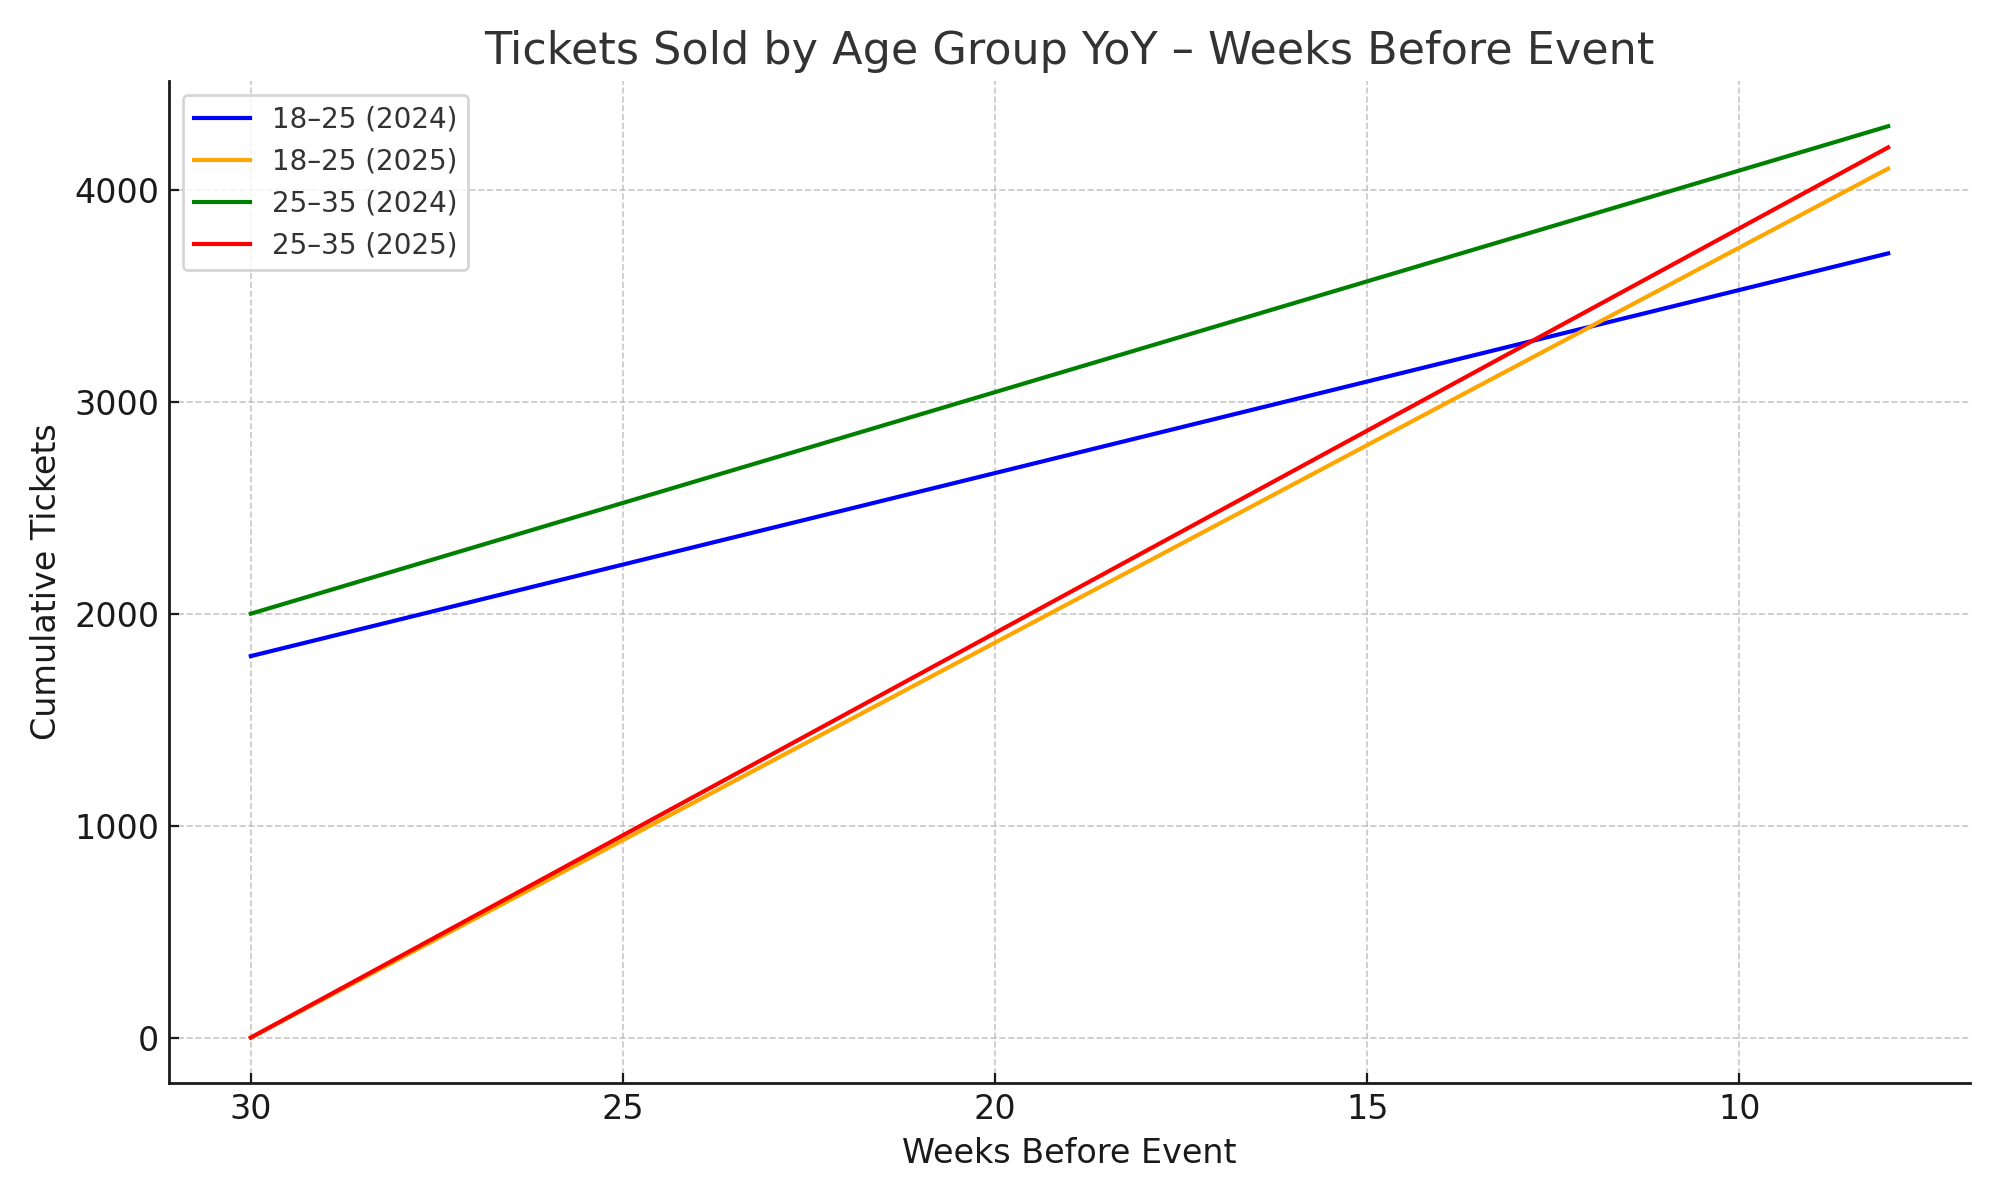
Tickets Sold by Age Group YoY - Weeks Before Event
A line chart tracking cumulative ticket sales by age group, plotted against weeks before the event.
How to use it:
- Understand which age groups are buying earlier or later
- Measure changes in purchasing momentum by demographic
- Compare pacing across events and identify early-bird opportunities
- Determine whether you’re reaching a younger or older demographic over time
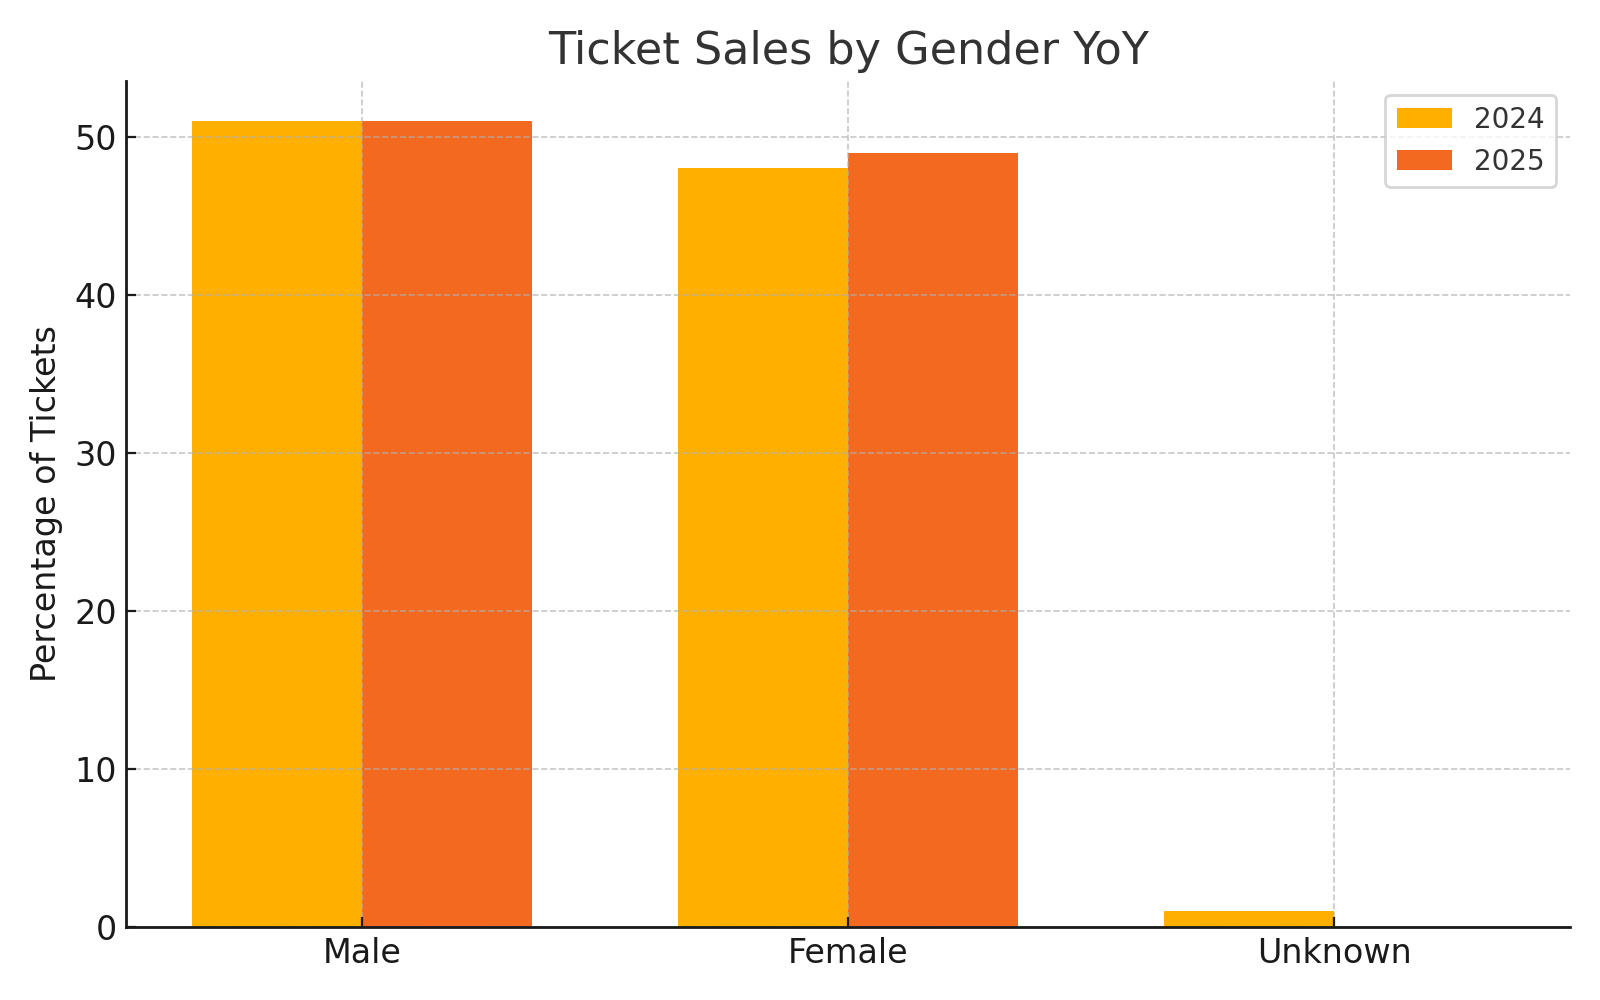
Ticket Sales by Gender YoY
A side-by-side bar chart comparing the percentage of total ticket sales by gender (e.g., Male, Female, Unknown) across the current and previous event years.
How to use it:
- Quickly assess whether your audience is balanced across genders or skews toward one
- Identify shifts in gender representation YoY that may influence marketing tone or campaign targeting
- Use this information to diversify messaging, refine influencer partnerships, or pitch more inclusive sponsorship packages
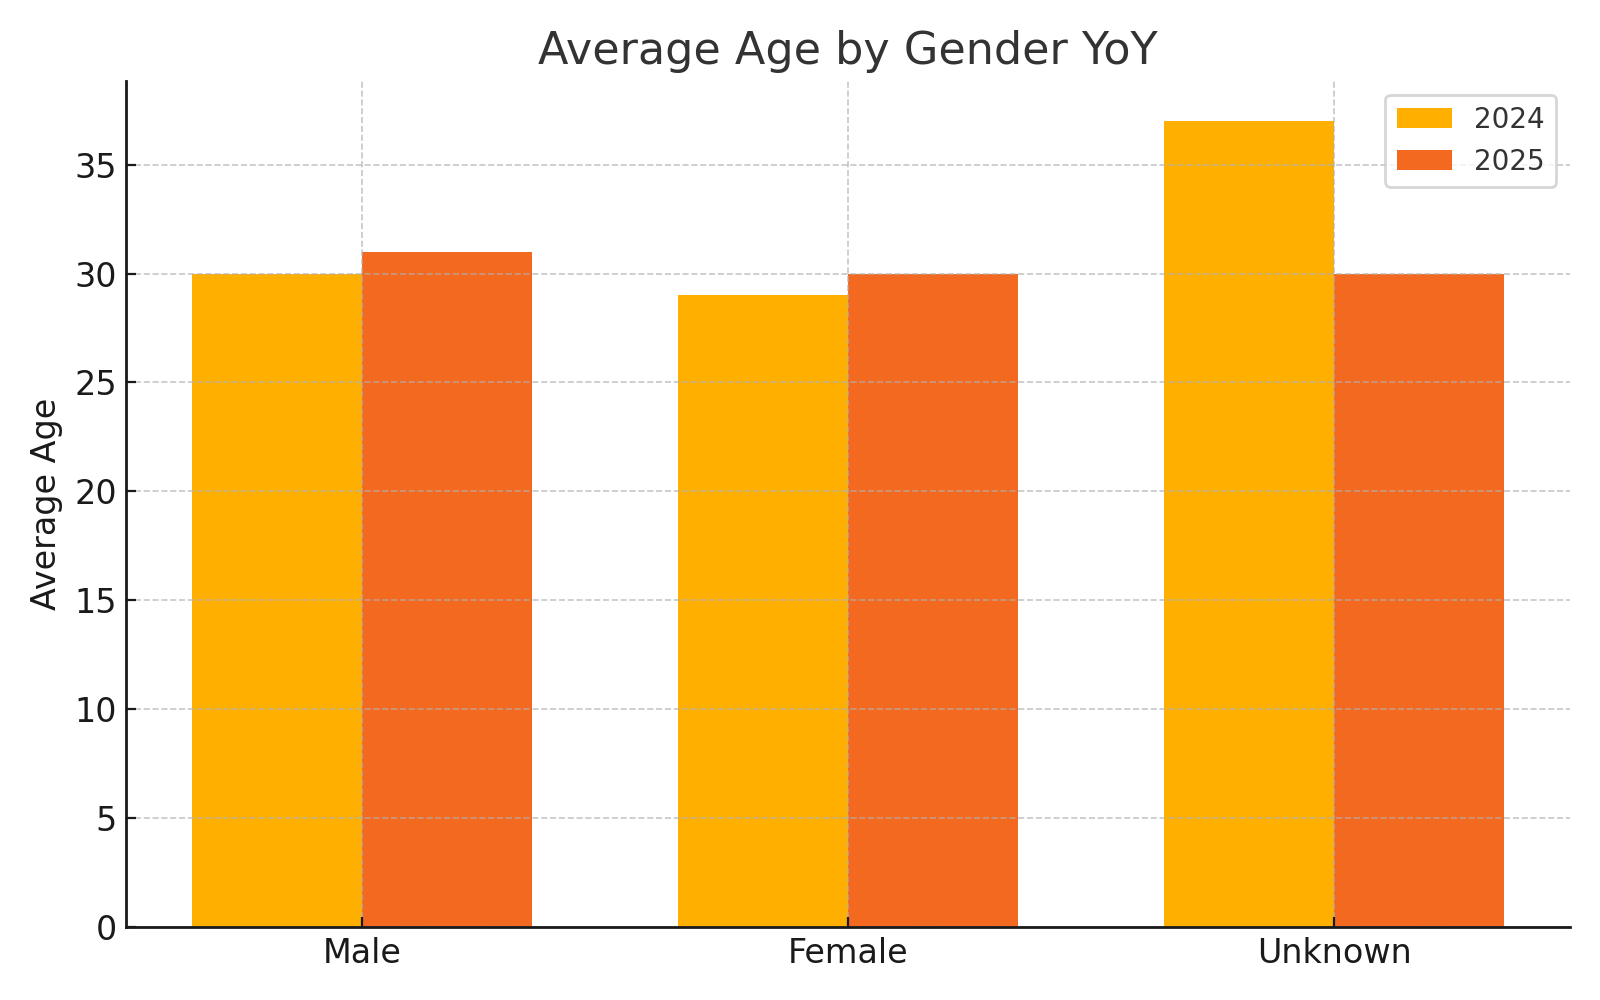
Average Age by Gender YoY
A grouped bar chart comparing the average age of ticket purchasers by gender (Male, Female, Unknown) across two event years.
How to use it:
- Spot any age-related shifts in your male vs. female audiences
- Determine whether you’re reaching a younger or older demographic over time
- Inform age-appropriate campaigns, influencer collaborations, or age-specific incentives (e.g., student pricing, VIP upgrades)
🙋 FAQs
Q: Can I track how different age groups respond to specific ticket types?
A: Yes – the bottom tiles in the Age and Gender section show which categories are favored by each age group.
Q: Are opt-ins linked to marketing platforms?
A: Opt-in data (Email/SMS) reflects preferences captured during ticket purchase and can be exported to your CRM.
Q: Can I see new vs returning customers per location?
A: Not in this dashboard directly, but we can create a custom view—reach out to your account manager.